2022-7-16 17:15 |
Be[In]Crypto takes a look at the five cryptocurrencies that increased the most last week, more specifically, from July 8 to 15.
These cryptocurrencies are:
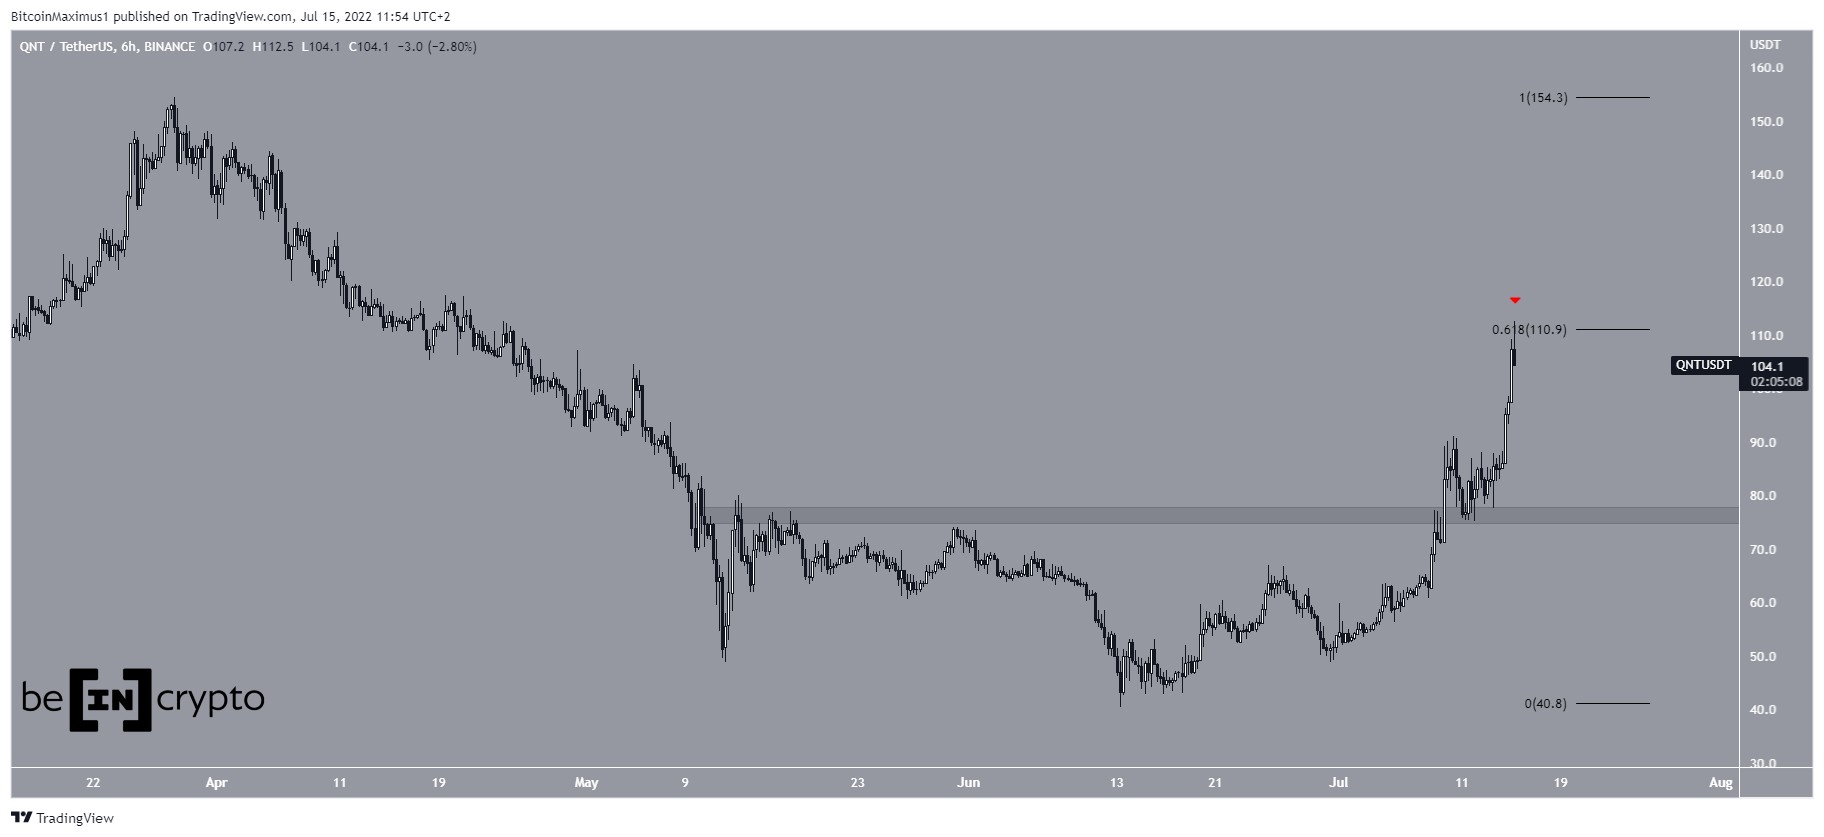
Quant (QNT) : 77.08%Aave (AAVE) : 34.94%Serum (SRM) : 27.70%Compound (COMP) : 26.68%Polygon (MATIC) : 26.09% QNTQNT has been moving upwards since falling to a low of $40 on June 14. So far, the upward movement has led to a high of $112.50 on July 15. The high was made right at the 0.618 Fib retracement resistance level, which in turn caused a rejection (red icon).
If the rejection leads to a more pronounced downward movement, the $78 horizontal area would be expected to provide support. The area had previously acted as resistance, but QNT broke out above it and validated it as support on July 10 (green icon).
QNT/USDT Chart By TradingView AAVEAAVE has been falling alongside a descending support line since Dec 2021. The downward movement has so far led to a low of $45.6 on June 18.
AAVE has been increasing since, in an upward movement that was preceded by bullish divergence in the RSI (green line). So far, AAVE has reached a high of $95.
A breakout above the $115 resistance area would indicate that the trend is bullish.
AAVE/USDT Chart By TradingView SRMOn June 4, SRM broke out from a descending resistance line that had previously been in place since the beginning of April. However, it failed to initiate any sort of upward movement.
Despite this lack of strength, the daily RSI continued generating bullish divergence (green line), finally initiating an upward movement on July 2. So far, SRM has reached a high of $1.09.
If the upward movement continues, the next closest resistance area would be at $1.85.
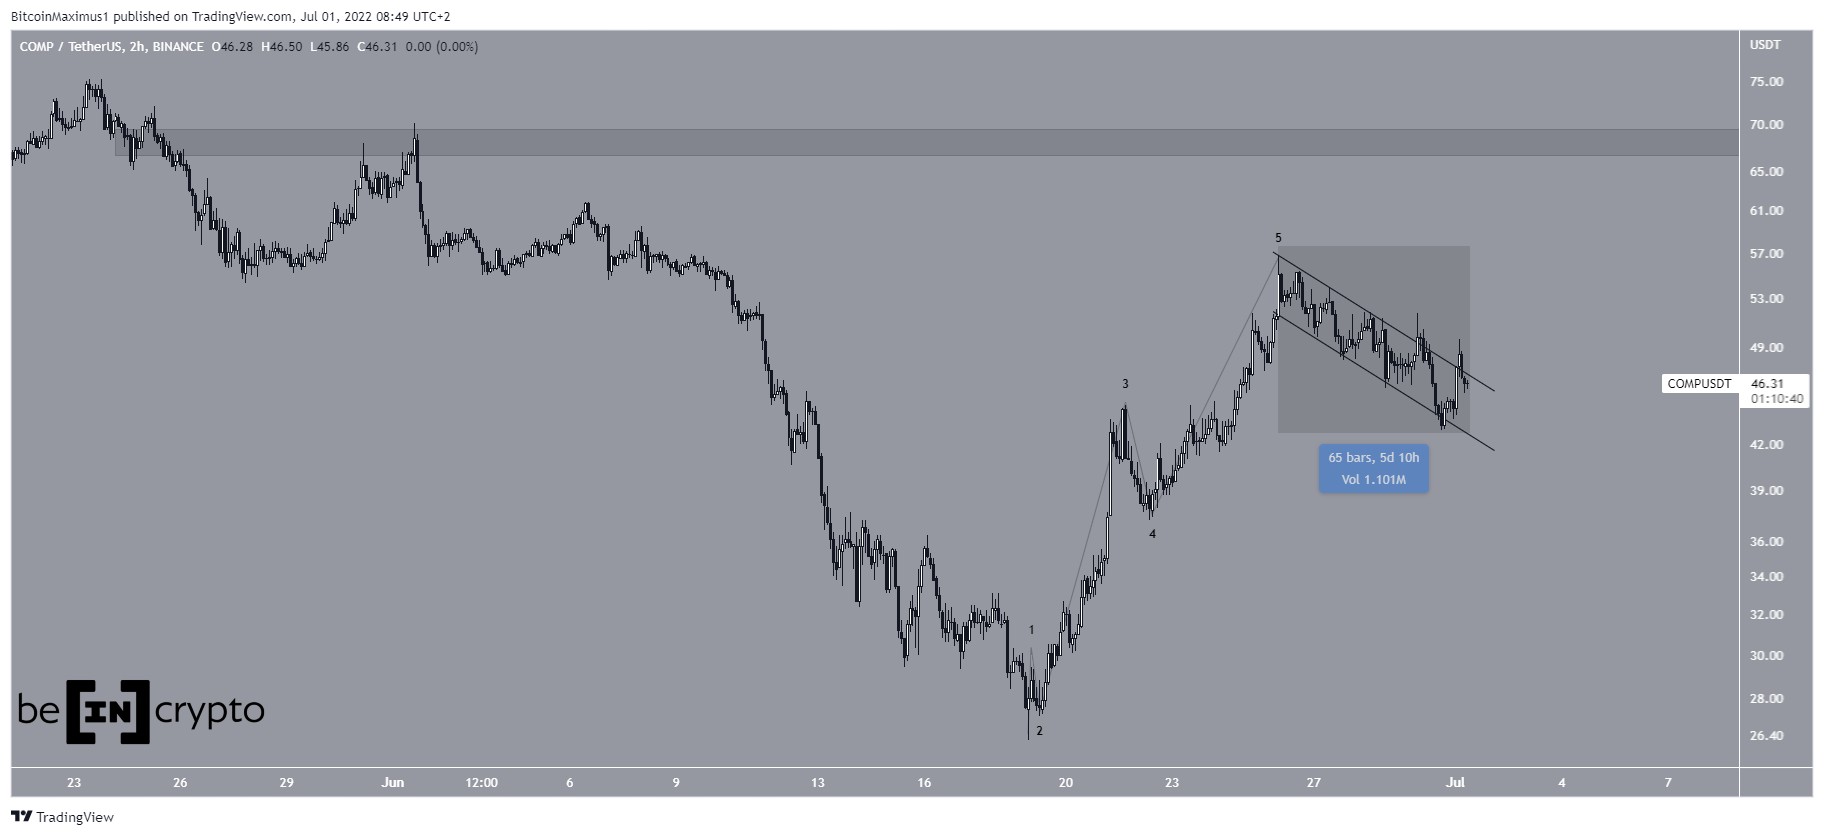
SRM/USDT Chart By TradingView COMPCOMP has been moving upwards since June 18. The price was initially rejected by both a descending resistance line and the $58 horizontal resistance area (red icon). However, it managed to break out from the resistance line and validate it as support on July 13 (green icon).
Currently, COMP is making another attempt at breaking out from the $58 resistance area. If successful, the next closest resistance would be at $105.
COMP/USDT Chart By TradingView MATICMATIC has been falling underneath a descending resistance line since reaching an all-time high price of $2.92 in Dec 2021. The downward movement led to a low of $0.316 on June 18.
The price has been increasing since, and broke out on July 8. At the time of the breakout, the line had been in place for 194 days. The entire upward movement was preceded by significant bullish divergence in the daily RSI (green line).
If the upward movement continues, the first long-term resistance area would be at $1.32. This is the 0.382 Fib retracement resistance level and a horizontal resistance area.
MATIC/USDT Chart By TradingViewFor Be[in]Crypto’s latest bitcoin (BTC) analysis, click here.
The post Polygon (MATIC) Increases 56% in July – Biggest Weekly Gainers appeared first on BeInCrypto.
origin »Bitcoin price in Telegram @btc_price_every_hour
Matic Network (MATIC) на Currencies.ru
|
|
