2021-10-6 16:53 |
Polkadot (DOT) has broken out from a short-term descending resistance line, putting an end to a downward movement that had been going on since Sept 14.
It is currently gearing up for an attempt at moving above its September highs and potentially a new all-time high price.
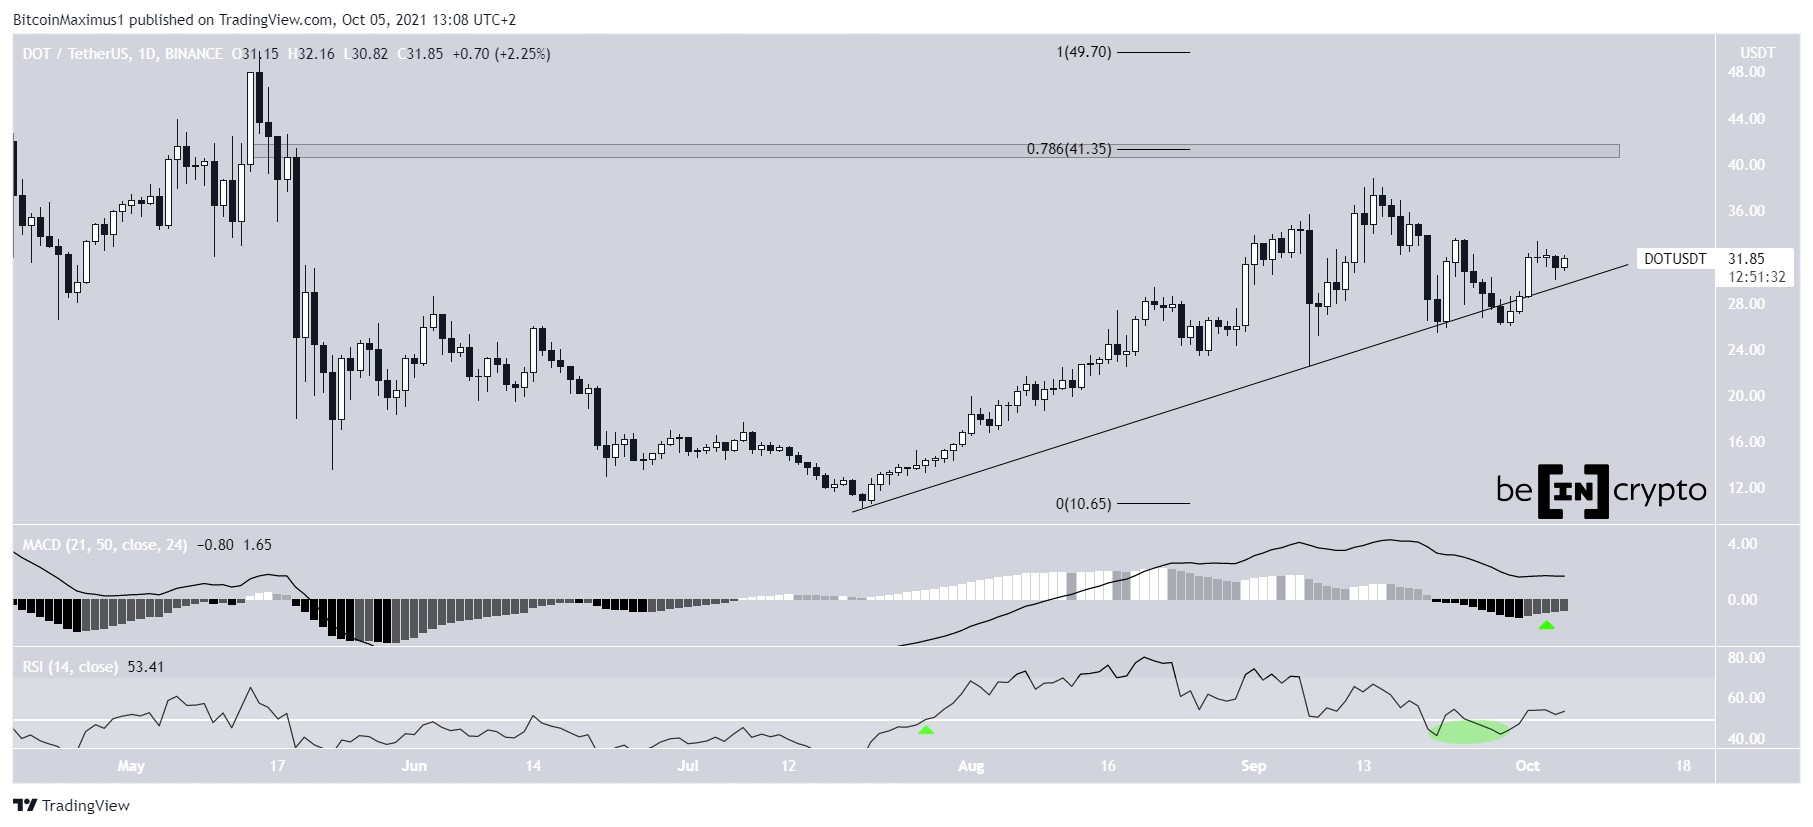
DOT moves towards resistanceDOT has been increasing alongside an ascending support line since July 20, when it had reached a low of $10.37. The upward movement is still ongoing, and so far a high of $38.77 was reached on Sept 14.
The main resistance area is at $41.35. This is the 0.786 Fib retracement resistance level and a horizontal resistance area.
Since DOT is trading above the ascending support line, the bullish structure is intact. Also, technical indicators support the continuation of the upward movement towards resistance.
The MACD has given a bullish reversal signal. The indicator is created by different moving averages (MA), and the increasing histogram (green icon) shows that momentum is increasing, since the short-term MA is moving faster than the long-term MA.
Also, the RSI has moved above 50, after previously deviating below the line (green circle). The RSI is a momentum indicator, and movements above/below 50 are seen as signs that the trend is bullish/bearish. The previous time the RSI moved above 50 (green icon) was on July 28, right at the start of the current upward movement.
Chart By TradingViewCryptocurrency trader @PostyXBT outlined a DOT chart, stating that he is adding to it at the bounce above $28.50 horizontal support area. The support area also coincides with the ascending support line, making it a very strong confluence of support levels.
If it were to break out above the $41.40 resistance area, DOT would likely increase towards the May highs near $50.
Source: Twitter Future movementThe shorter-term two-hour chart also provides a bullish reading. It shows that DOT has broken out from a descending resistance line. The line had previously been in place since Sept 14, so a breakout from it is a sign of a potential trend change.
The RSI and MACD readings are the same as in the daily time-frame. The former has moved above 50 while the latter is positive and shows an increasing short-term trend.
Currently, DOT is facing resistance from the 0.618 Fib retracement resistance level at $33.70. If it manages to move above it, it would be expected to increase towards the previously outlined $41.40 resistance area.
Chart By TradingViewFor BeInCrypto’s latest Bitcoin (BTC) analysis, click here.
What do you think about this subject? Write to us and tell us!
The post Polkadot (DOT) Could See Potential Breakout from September Highs appeared first on BeInCrypto.
origin »Bitcoin price in Telegram @btc_price_every_hour
Dotcoin (DOT) на Currencies.ru
|
|