2021-9-23 20:02 |
Bitcoin (BTC) bounced considerably on Sept 22, potentially marking the end of a nearly two week long downward movement.
Afterwards, the ongoing increase has invalidated a significant portion of potential bearish counts. Therefore, it is likely that BTC has bottomed.
Two possibilitiesCryptocurrency trader @TheTradinghubb outlined two potential counts for BTC, one bullish and the other bearish. In this article, we will take a look at both and determine which is the most likely to transpire.
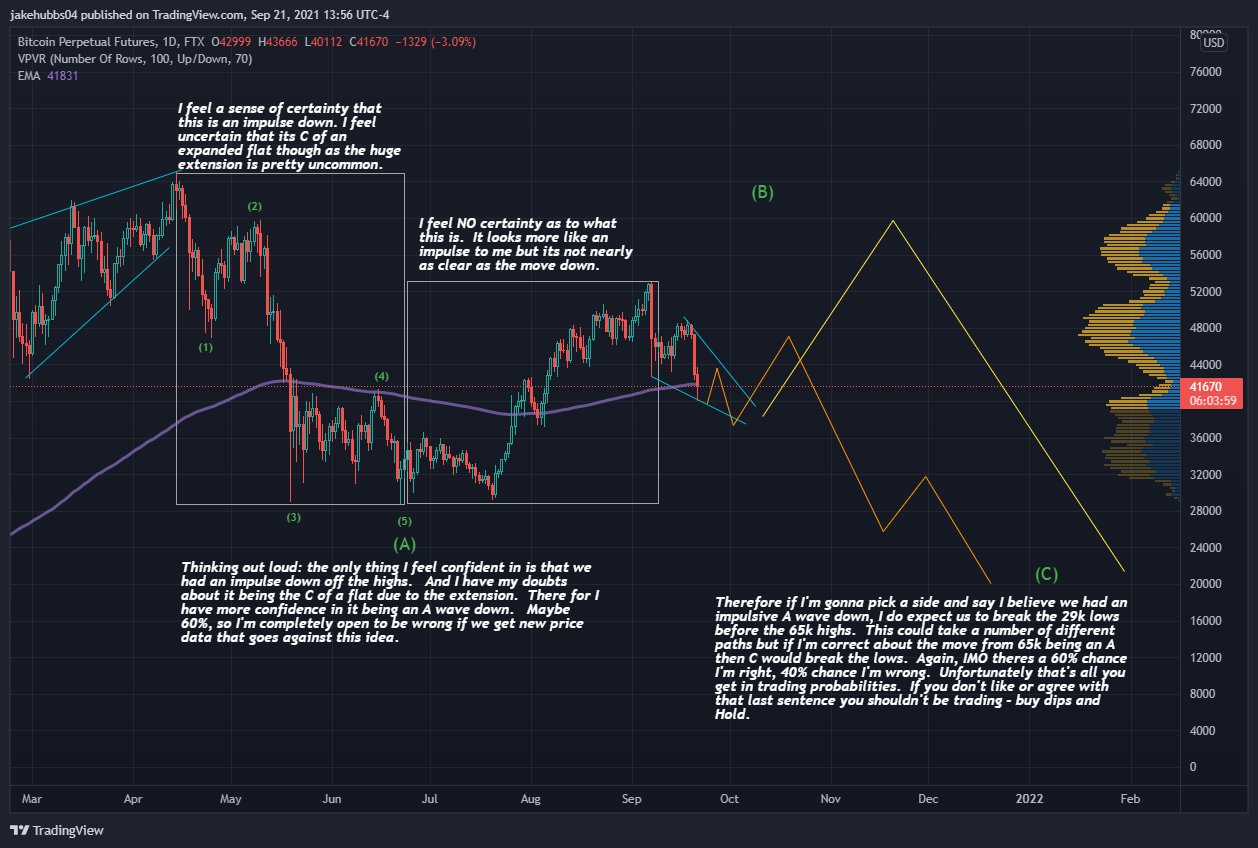
Source: Twitter Bullish BTC countThe only thing that seems certain for the BTC movement is that the decrease from the April 14 all-time high (highlighted) is a five wave bearish impulse. However, it is not certain if that is part of a C wave (white) or if it is the beginning of a new bearish impulse.
The bullish count indicates that it is a C wave. Therefore, a new impulse (white) began on June 22. The ongoing decrease since Sept 7 was part of wave 2. Afterwards, the bounce on Sept 22 likely marked the end of the correction. The fact that the bounce occurred right at the 0.5 Fib retracement level further solidifies this possibility.
Chart By TradingViewThe sub-wave count is given in orange. The aforementioned decrease resembles a textbook A-B-C corrective structure, in which waves A:C had a 1:1 ratio.
Furthermore, the movement is contained inside a descending parallel channel.
Chart By TradingViewThe increase above the wave one low at $42,900 (red line) invalidates the majority of potential bear counts, unless this is a massive 1-2/1-2 formation, which seems extremely unlikely.
Chart By TradingView Bearish BTC countThe bearish count suggests that the entire upward movement since June 22 was part of a corrective structure (orange). In this case, another downward movement that takes the price below the June 22 lows would be expected (white).
The issue with this count is the length of the C wave (orange), which is nearly 3.61 times as long as wave A.
Chart By TradingView Chart By TradingViewHowever, even if the count proves to be true, an upward movement towards $50,000 would be initially expected before the ensuing drop.
Chart By TradingViewFor BeInCrypto’s latest Bitcoin (BTC) analysis, click here.
What do you think about this subject? Write to us and tell us!
The post Outlining Bitcoin’s (BTC) Most Likely Wave Count appeared first on BeInCrypto.
origin »Bitcoin price in Telegram @btc_price_every_hour
Bitcoin (BTC) на Currencies.ru
|
|


