2022-8-5 19:00 |
Be[In]Crypto takes a look at the five cryptocurrencies that decreased the most last week, more specifically, from July 29 to Aug 5.
These cryptocurrencies are:
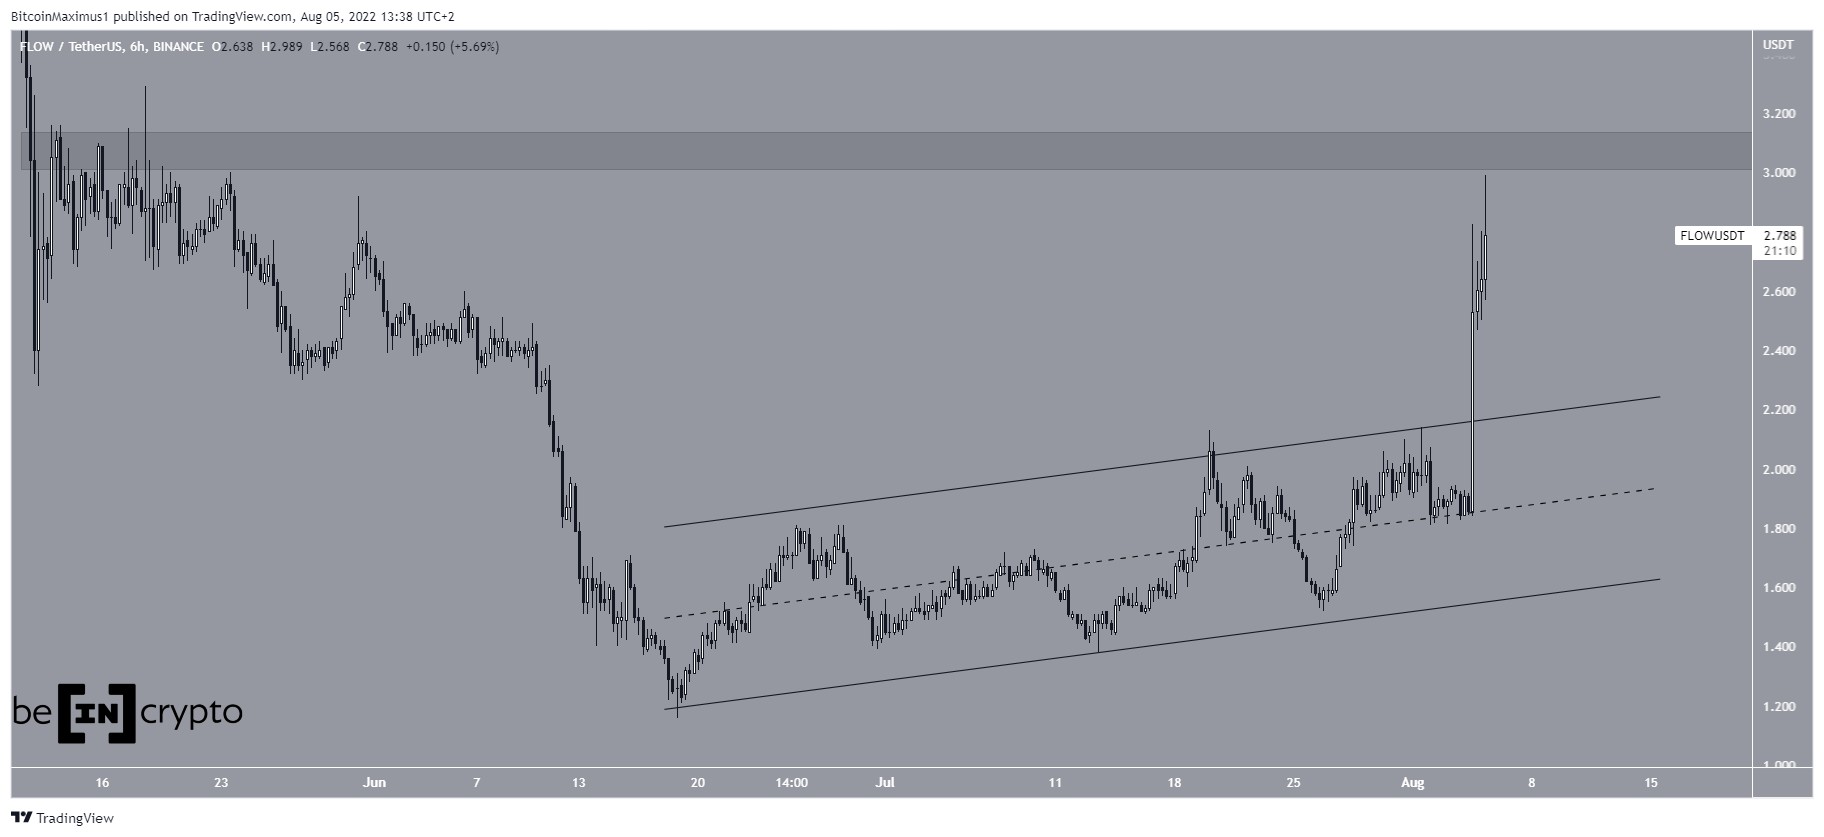
Flow (FLOW) : 47.94%Filecoin (FIL) : 39.59%Optimism (OP) : 28.86%Chiliz (CHZ) : 23.87%Yearn.Finance (YFI) : 22.37% FLOWFLOW had been increasing inside an ascending parallel channel since June 18. It managed to break out from it on Aug 4 and reached a high of $2.98 the next day.
FLOW barely failed to reach the main resistance area at $3.10.
If it manages to break out from it, the rate of increase could greatly accelerate due to the lack of overhead resistance above $3.10.
FLOW/USDT Chart By TradingView FILFIL has been gradually moving upwards since June 18. It broke out from a descending resistance line on July 17 and accelerated its rate of increase afterwards. This led to a high of $11.39 on Aug 1. However, it was rejected by the $11.25 horizontal resistance area and has been decreasing since.
The most likely area to provide support is between $7.40 and $8.20, created by the 0.5-0.618 Fib retracement support level.
Conversely, the next resistance area is at $15.80.
FIL/USDT Chart By TradingView OPOP has been increasing alongside an ascending parabolic support line since July 13. In a period of 22 days, the price has increased by 440%. This led to a new all-time high price of $2.25 on Aug 4.
While the price has decreased slightly since, the parabolic support line is still intact and so is the bullish trend.
OP/USDT Chart By TradingView CHZCHZ has been increasing since June 18. On Aug 1, it broke out from the $0.134 horizontal resistance area and validated it as support the next day.
If the upward movement continues, the next closest resistance area will be between $0.205 – $0.235. This is created by the 0.5-0.618 Fib retracement resistance levels.
CHZ/USDT Chart By TradingView YFIYFI had been increasing inside an ascending parallel channel since June 18. It broke out from this channel on July 29 and reached a high of $14,200 the next day.
The price has been decreasing since, and is in the process of validating the resistance line of the channel, completing a fourth-wave pullback. If successful, this would lead to another upward movement towards $17,000.
A decrease below the wave one high (red line) at $8,087 would invalidate this particular wave count.
YFI/USDT Chart By TradingViewFor Be[in]Crypto’s latest Bitcoin (BTC) analysis, click here
The post Optimism (OP) Reaches New All-Time High: Biggest Weekly Gainers appeared first on BeInCrypto.
origin »Bitcoin price in Telegram @btc_price_every_hour
High Voltage (HVCO) на Currencies.ru


|