2022-6-4 21:45 |
In this article, BeInCrypto takes a look at the five cryptocurrencies that decreased the most over the past seven days, more specifically from May 27 to June 3.
These cryptocurrencies are:
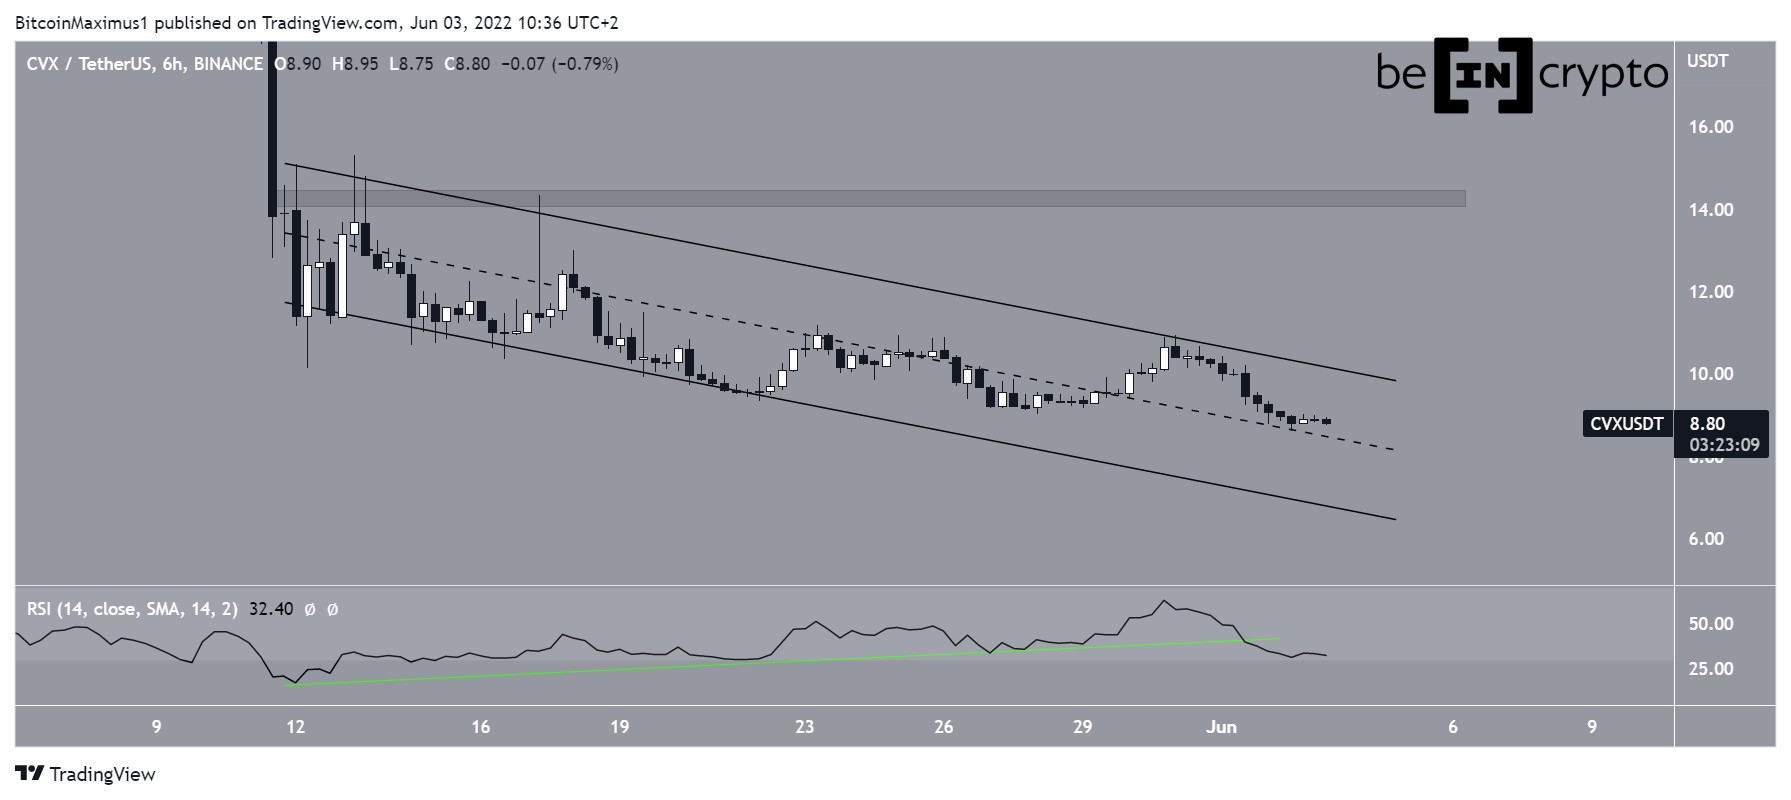
Convex Finance (CVX): -7.43%Amp (AMP): -3.02%OKB (OKB): -2.90%Ethereum Classic (ETC): -2.10%Celo (CELO): -1.82% CVXCVX has been decreasing inside a descending parallel channel since May 12. Such channels usually contain corrective movements, meaning that a breakout from it would be expected.
Initially, the six-hour RSI generated a bullish divergence, a sign that a breakout might occur. However, the trendline of the divergence broke down on June 1.
If the price loses the middle of the channel, it could continue decreasing towards a new all-time low.
CVX/USDT Chart By TradingView AMPAMP has been falling inside a descending parallel channel since May 13. The channel has caused several rejections, most recently on June 1.
Even though the channel is considered a corrective pattern, meaning that it leads to breakouts the majority of the time, there are no bullish reversal signs in place yet.
Similar to CVX, a decrease below the middle of the channel could lead to lower prices.
AMP/USDT Chart By TradingView OKBOKB reached a low of $10 on May 12, but bounced sharply and created a long lower wick immediately afterward. It is currently trading at $11.40 and has seemingly created a triple bottom pattern.
Additionally, the pattern has been combined with a bullish divergence in the RSI (green line). But, the trendline of the divergence is at risk of breaking down. If it does, lower prices can be expected.
Conversely, if the line stays intact, an increase towards $15.10 could occur.
OKB/USDT Chart By TradingView ETCETC has been falling underneath a descending resistance line since March 9. This led to a low of $16.02 on May 12.
Afterward, ETC broke out from the resistance line but failed to reclaim the $25 resistance area. Furthermore, the RSI was rejected by the 50 line.
Until the price reclaims the $25 area and the RSI moves above 50 (red icon), the trend cannot be considered bullish.
ETC/USDT Chart By TradingView CELOCELO has been trading inside a symmetrical triangle since May 12. While this is considered a neutral pattern, it is coming after a downward movement. As a result, a breakdown of it would be the most likely scenario.
Currently, the price is very close to the support line of the triangle. A decrease below it would be expected to accelerate the rate of decrease.
CELO/USDT Chart By TradingViewFor Be[in]Crypto’s latest bitcoin (BTC) analysis, click here
The post OKB Creates Bullish Pattern After New Yearly Low: Biggest Weekly Losers appeared first on BeInCrypto.
origin »Bitcoin price in Telegram @btc_price_every_hour
OKB (OKB) на Currencies.ru
|
|