2022-4-20 17:44 |
The masses are bearish on Bitcoin. The market is convinced that prices below $30,000 will be revisited given the continued weakness in the top cryptocurrency by market cap. All eyes are on the massive “bear flag,” but could it instead be a bear trap?
Bitcoin price continues to grind along a decade long parabolic trend line that in the past has put in several mid- to long-term bottoms. Here is a closer look at a currently unbroken trend line that BTCUSD must hold for continued parabolic momentum and what it could mean if we get a bounce from here.
Unbroken Decade-Long Parabolic Bull Trend Readies Base 4If you ask around, most people will explain with certainty the several reasons they have for why Bitcoin is destined for sub-$30,000. Meanwhile, the price per BTC is grinding along a parabolic support line that over the last decade has proven to put in bottom after bottom.
Related Reading | Bitcoin Bear Market Comparison Says It Is Almost Time For Bull Season
The cryptocurrency became a household name in late 2017 due to its parabolic rally that eventually broke down and took the price per cryptocurrency back to $3,200. The retest of that level on Black Thursday only added to the base-building in the chart below.
Attention, base 4. Are we cleared for liftoff? | Source: BTCUSD on TradingView.comComparing the curved, decade-long trend line with the parabolic curve pattern pictured above, there is a chance base 4 is in the process of being built. Between base 3 and base 4, the parabolic asset – BTC in this case – doubles in value in a very short time.
From late 2020 to April 2021, Bitcoin price grew over six to twelve times in value during what would have been the run up from base 3 to base 4. According to this diagram, base 4 is also quite steep, allowing price to climb dramatically higher. The only problem is, this final base, if valid, suggests the end is near for this decade-long bull trend line.
With a parabolic trend line violated, the top cryptocurrency by market cap could plunge as much as 80% from whatever highs are set. Past bear markets have resulted in more than 84% declines from top to bottom. Parabolic rallies also tend to break down faster than it took to climb – similar to a rollercoaster’s anxiety-inducing ascent, followed by a speedy plunge and the ride is over until you decide to get on once again.
“Bulls take the stairs, bears take the elevator”
On-chain signals support a bottom at this level | Source: Glassnode On-Chain Signals Support Bitcoin Bottom At Current LevelsOn-chain signals, like entity-adjusted dormancy flow exhibit similar signs of accumulation going on as other moments Bitcoin put in a significant bottom. Several of these on-chain bottoms arrived precisely as the price per BTC touched down on the parabolic trend line.
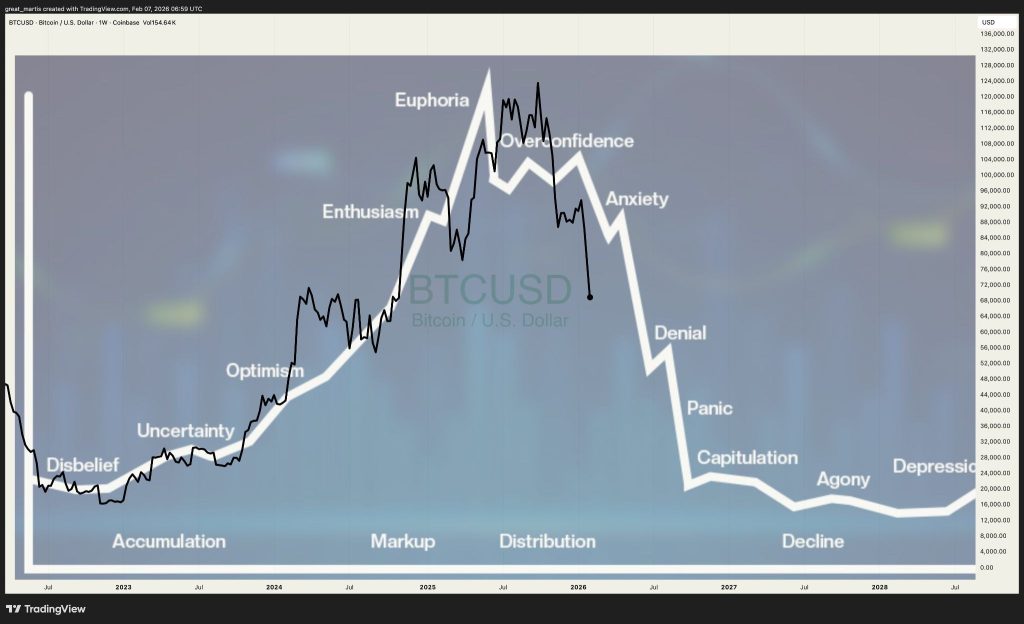
Related Reading | Crypto Mimics Textbook Market Sentiment Cycle, What Happens When Confidence Returns?
Could this be a mere coincidence, or is there more validity that this parabolic trend line holds, a new base is build, and the final phase of the Bitcoin rally begins?
Follow @TonySpilotroBTC on Twitter or join the TonyTradesBTC Telegram for exclusive daily market insights and technical analysis education. Please note: Content is educational and should not be considered investment advice.
Featured image from iStockPhoto, Charts from TradingView.com origin »Bitcoin price in Telegram @btc_price_every_hour
Bitcoin (BTC) на Currencies.ru
|
|