Chart - Свежие новости [ Фото в новостях ] | |


Bitcoin Following The 2022 Cycle? What To Expect If It Plays Out The Same Way
The current structure of Bitcoin may be unfolding in a way that closely resembles the transition that led into the 2022 bear market. A chart shared by an analyst on X highlights several technical signals that appeared during the 2021–2022 shift and are now emerging again in 2026. дальше »
2026-3-13 22:00 | |
|
|
Hyperliquid price prediction: can HYPE hit a new ATH after $38 break?
Hyperliquid price rose to its highest level in over a month as it touched $38. 08. The HYPE is up amid increased trading activity as open interest jumps to over $1. 56 billion. Technical indicators on the daily chart suggest a bullish continuation. дальше »
2026-3-13 18:59 | |
|
|
Here’s Why Silver Could Still Hit $120 Despite Resistance
Everyone’s talking about silver right now. The charts are looking interesting, analysts are chiming in, and despite some resistance in the near term, the bigger picture still seems intact. The 4-hour chart for silver shows a pretty clear picture. дальше »
2026-3-11 01:00 | |
|
|
Ethereum price flashes an alarming pattern as ETF outflows rise
Ethereum price has gone nowhere since February 7 this year. While this could be a sign of bottoming, it has formed an alarming chart pattern, signaling a potential crash. Ethereum (ETH) price was trading at $2,065 today, March 10, as… дальше »
2026-3-11 18:25 | |
|
|
Bitcoin rainbow chart's undervaluation signal vs supply overhang - Which one wins?
Bitcoin [BTC], at the time of writing, had creeped back above the key $70k resistance. It found a surge in demand around the $65k-zone over the weekend, despite the gloomy news across the wider marketThe post Bitcoin rainbow chart's undervaluation signal vs supply overhang - Which one wins? appeared first on AMBCrypto. дальше »
2026-3-10 10:00 | |
|
|
XRP Starts New Week With Bullish Confirmation, But This Level Is A Problem
XRP has entered the new week with a technical setup that is beginning to tilt in favor of bulls, even though the price action is stuck inside a range. A bullish divergence has appeared on the daily chart, hinting that downside momentum may be fading and that a rebound could be close. дальше »
2026-3-10 01:00 | |
|
|

New Bitcoin signal shows where BTC is likely to decide its next move
Bitcoin spent the weekend mostly within a familiar price channel, then slipped lower before recovering as traders reacted to the developing impact of the Iran war. However, while real-world macro events now dictate Bitcoin's movements more than fundamentals or adoption levels, where on the chart it stops to test the waters has not changed. дальше »
2026-3-10 19:29 | |
|
|
New Bitcoin indicator reveals we just avoided a major drop — but one level could decide the next breakout
Bitcoin spent the weekend mostly within a familiar price channel, then slipped lower before recovering as traders reacted to the developing impact of the Iran war. However, while real-world macro events now dictate Bitcoin's movements more than fundamentals or adoption levels, where on the chart it stops to test the waters has not changed. дальше »
2026-3-10 19:29 | |
|
|
Saylor hints at Strategy’s 101st Bitcoin purchase as price slips amid US-Iran tensions
Strategy may be gearing up for its 101st Bitcoin purchase, according to a cryptic post shared by co-founder Michael Saylor. As is often the case with Saylor’s posts, he shared Strategy’s Bitcoin accumulation chart, which tracks the company’s purchases since… дальше »
2026-3-10 07:57 | |
|
|
XRP Price Prediction Target And Bitcoin Miners Pivot Billions to AI and Pepeto Shows Explosive Potential Ahead of Launch
The XRP price prediction community is watching $1.40 support like their portfolios depend on it. But the bigger story is not about XRP holding a line on a chart. MARA Holdings and Riot Platforms are liquidating billions in Bitcoin reserves to pivot into AI computing, which tells you where the smart money sees the future […] The post XRP Price Prediction Target And Bitcoin Miners Pivot Billions to AI and Pepeto Shows Explosive Potential Ahead of Launch appeared first on CaptainAltcoin. дальше »
2026-3-8 21:00 | |
|
|
Bitcoin May Be Closer to a Bottom Than Most Think, Chart Signals
The Bitcoin price slipped about 2% today, trading slightly below $68,000 after pushing above $73,000 earlier this week, as already covered on our site. The move added fresh pressure to a market that still feels shaky, especially after several failed attempts to hold higher levels. дальше »
2026-3-8 22:45 | |
|
|

XRP 200EMA Sweep To Trigger Rally? Analyst Shows Path To $8.5
Despite XRP’s continued decline and its struggle to regain the $2 level, one analyst believes the asset is approaching a decisive technical zone that could determine the next rally. A chart breakdown from crypto analyst Egrag Crypto shows that if XRP reclaims key levels above the 200-week EMA, it could strengthen momentum and open the […] дальше »
2026-3-7 04:00 | |
|
|

Dogecoin Price Could See A Major Spike To $10 If This Trend Repeats
The Dogecoin price may be on the verge of its most historic rally yet, as a crypto market analyst has boldly forecasted an explosive rally to $10. Pointing to historical chart patterns, the analyst believes that if Dogecoin can perfectly repeat past cycle trends, a surge into double-digit territory seems highly probable. Historical Dogecoin Price […] дальше »
2026-3-7 00:30 | |
|
|
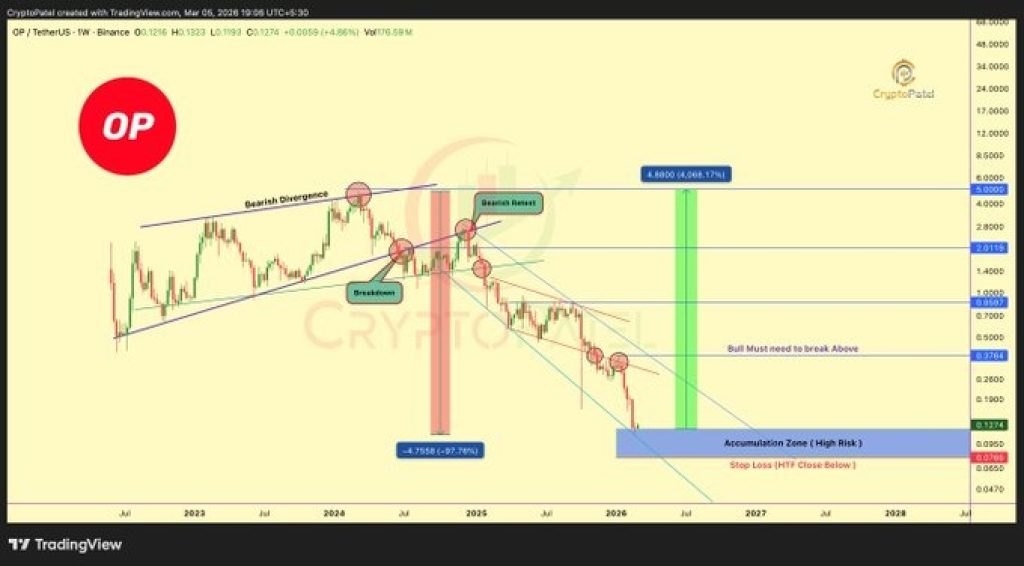
Analyst Says Optimism (OP) Could Deliver 4,000% Upside – Here’s How
Optimism (OP) has been through a brutal correction since its last cycle peak, but some analysts believe the project may now be entering a long-term accumulation phase. One of them is crypto analyst Crypto Patel, who shared a chart outlining why the OP price could still have substantial upside potential despite the heavy drawdown. дальше »
2026-3-6 01:45 | |
|
|

Elliot Wave Theory Says Bitcoin Price Is Headed To $40,000, But The End Game Will Shock You
A technical analyst known as ‘V’ has shared a striking Elliott Wave Theory-based Bitcoin price outlook on X that he believes most market participants are completely overlooking. The chart, plotted on Bitcoin’s weekly timeframe, outlines a multi-year roadmap that could first subject the cryptocurrency to significant downside pressure, potentially triggering a price crash to $40,000 before setting the stage for an explosive rally that could shock investors and traders. дальше »
2026-3-4 18:00 | |
|
|
Here’s Where Solana (SOL) Price Is Headed in March
Solana is walking into March trying to shake off a tough February. On the monthly chart, the SOL price closed down about 21. 5%, tracking the broader weakness across altcoins as risk appetite faded. дальше »
2026-3-3 00:00 | |
|
|
Oil Goes Where Silver Goes: Long-Term Chart Signals Higher Prices Ahead
Market technician Patrick Karim shared a striking long-term chart this week with a simple message: “Crude Oil. Whatever happens on the Monday open is irrelevant on the longer-term roadmaps. The pathway for higher prices for crude oil has been laid out by silver & gold. дальше »
2026-3-2 03:00 | |
|
|
ChatGPT Predicts the Price of Cardano and Polkadot If the CLARITY Act Passes
It’s March 1, and for once, the biggest thing in crypto isn’t happening on a chart, it’s happening in Washington. Today is the deadline for the White House to lock in the CLARITY Act. Traders, investors, and companies are watching because this bill is supposed to answer a simple but important question: who actually regulates […] The post ChatGPT Predicts the Price of Cardano and Polkadot If the CLARITY Act Passes appeared first on CaptainAltcoin. дальше »
2026-3-1 13:30 | |
|
|
Here’s Where XRP Price Could Be Headed This New Week
XRP begins the week with good news in the background, but the chart still looks careful. Ripple CTO David Schwartz shared that Ripple has no power to block or censor transactions on the XRP Ledger. дальше »
2026-3-1 09:52 | |
|
|
Bitcoin Has Officially Entered Bearish Territory, And It’s Headed To $35,000; Chart Shows
Bitcoin’s higher-timeframe structure is in an interesting state, according to crypto analyst Crypto Patel, who is of the notion that the cryptocurrency has officially entered bearish territory after breaking a long-term support level at $107,000. дальше »
2026-2-28 17:00 | |
|
|

Solana’s Next Major Support Levels Sit At $50, $22, And $10: Analyst
An analyst has pointed out where Solana support levels could lie based on a Parallel Channel forming in the asset’s weekly price chart. Solana Parallel Channel Could Indicate Support At These Levels In a new post on X, analyst Ali Martinez has discussed how support is looking for Solana from the perspective of a Parallel Channel that may be emerging in its 7-day price. дальше »
2026-2-28 09:00 | |
|
|

Bitcoin Vs. Altcoins: You Should See This Chart That Shows Another Alt Season Is About To Begin
Talks of a potential altcoin season this cycle have since subsided compared to previous years, despite the recent decline in the Bitcoin (BTC) price and dominance. Notably, a crypto analyst has shared a new long-term chart showing the total altcoin market capitalization relative to Bitcoin at a level that has historically preceded major alt seasons. […] дальше »
2026-2-28 23:00 | |
|
|

XRP Triangle Could Point To Support Between $0.60 And $0.90
A cryptocurrency analyst has pointed out how support could lie between the $0. 60 and $0. 90 levels for XRP, based on this technical analysis (TA) pattern. XRP Could Be Moving Inside An Ascending Triangle In a new post on X, analyst Ali Martinez has shared a TA pattern forming in the monthly price chart of XRP. дальше »
2026-2-27 11:00 | |
|
|
5 Monthly Red Candles: How XRP Is About To Create A Historical Losing Streak
XRP’s higher-timeframe structure is approaching a rare technical milestone on the monthly chart. The cryptocurrency is still on an extended pullback from its 2025 highs above $3 and is now trading around $1. дальше »
2026-2-27 22:00 | |
|
|

Analyst Predicts Bitcoin Price Surge To $500,000 As Ribbon Fractal Emerges
A prominent market commentator has projected that the Bitcoin price could climb as high as $500,000, citing the reappearance of a long-observed moving average ribbon pattern on the monthly chart. The forecast, shared by Egrag Crypto on X, ties price structure to specific time windows in 2026 and 2028, arguing that technical alignment is outweighing short-term market narratives. дальше »
2026-2-27 19:00 | |
|
|
S&P 500 Erases AI Panic in 48 Hours as Crisis Narrative Crumbles
The Kobeissi Letter posted a chart on X showing something striking: the S&P 500 has now climbed above the same level it held before the February 22nd “AI crisis” report. That report, labeled the “2028 Global Intelligence Crisis,” caused a sharp drop in stocks as fear spread through markets. дальше »
2026-2-26 01:00 | |
|
|
Morning Crypto Report: Cardano (ADA) Listed on Bitstamp Singapore, Peter Brandt Skeptical of $150K Bitcoin Target, Dogecoin Price Confirms 'Death Cross' on Weekly DOGE Chart
Midweek crypto market opens with the listing of the ADA token on Bitstamp in Singapore, Peter Brandt crushing the $150,000 BTC dream and Dogecoin flashing a grim technical signal called a "death cross.". дальше »
2026-2-26 15:44 | |
|
|
XRP price prediction: Can bulls break $2 as Bitcoin reclaims $65K?
XRP price is back in focus as Bitcoin stages a sharp 24-hour rebound, reclaiming the $65,000 level after dipping to roughly $62,800 earlier this week. Can XRP price follow Bitcoin’s $65K rebound? The Bitcoin (BTC) price chart shows a strong… дальше »
2026-2-25 10:00 | |
|
|

Shiba Inu (SHIB) Price Slips Below Key Level – Is a Bigger Move About to Unfold?
Shiba Inu has dipped under $0. 0000060, a price area that kept catching the recent pullbacks. That cushion is gone for now. The SHIB price is trading at $0. 00000592, sitting just below a level that had been doing most of the heavy lifting on the chart. дальше »
2026-2-25 01:30 | |
|
|

If Bitcoin loses this level, the chart’s winter path to $49,000 opens up fast
Bitcoin spent the last two days sliding down a familiar set of shelves, and the order book kept printing lower bids as liquidity thinned. By this morning, it sat at $63,214, a level that places the price inside the lower band on my two-year channel map. дальше »
2026-2-25 00:20 | |
|
|
ACH token remains extremely bearish as Alchemy Chain expands its supply
Alchemy Pay’s ACH token has been under heavy pressure in recent weeks. Since late January, the token has been locked in a relentless downtrend. ACH price chart | Source: Coingecko The upper resistance zone around $0. дальше »
2026-2-25 15:22 | |
|
|
DOGE chart targets $0.06 with weak volume, MAs still bearish
DOGE has slid below key weekly MAs, risking a drop toward $0.06 on weak volume and downside Bollinger pressure. A cryptocurrency analyst has warned that Dogecoin (DOGE) could decline to $0.06, citing technical indicators that suggest continued downside pressure, according… дальше »
2026-2-25 14:57 | |
|
|
Pi Network Posts Record Growth Metrics, So Why Does the Pi Coin Chart Look Dead?
Pi Network just marked another milestone since launching its Open Network, highlighting what it describes as solid ecosystem growth across multiple fronts. From KYC completions to Mainnet migrations and developer activity, the numbers look impressive on paper. дальше »
2026-2-24 11:30 | |
|
|
Will Bitcoin's falling network activity hamper Saylor's 100th BTC purchase?
While there is a lot of air around Bitcoin [BTC] falling below $65,000, Michael Saylor is still focused on buying more. On the 22nd of February, he shared his latest “Orange Century” chart on The post Will Bitcoin's falling network activity hamper Saylor's 100th BTC purchase? appeared first on AMBCrypto. дальше »
2026-2-24 05:00 | |
|
|

Bitcoin Buying Spree Nears Century Mark, Saylor Hints
Michael Saylor’s quiet hint this weekend put a spotlight on a methodical habit that has quietly shaped corporate crypto moves for years. Related Reading: XRP Flashes Rare On-Chain Signal That Once Preceded 114% Gains Michael Saylor posted a chart with the caption “The Orange Century,” and through that single image he signaled what many traders already suspected: the company he chairs is poised to make another buy. дальше »
2026-2-23 17:00 | |
|
|