Candlestick - Свежие новости [ Фото в новостях ] | |

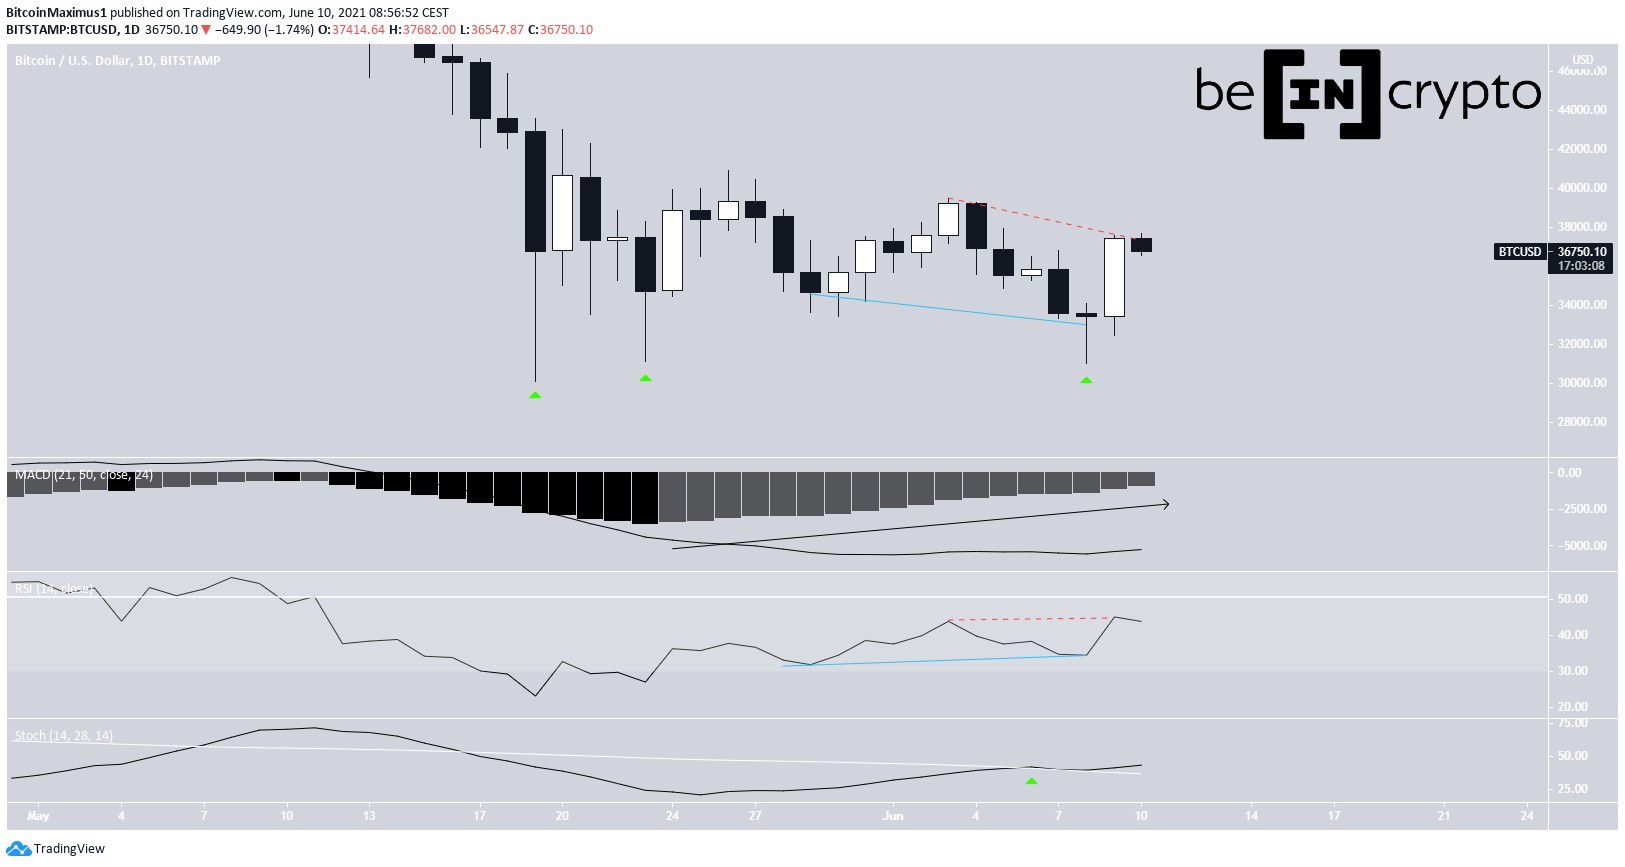
BTC, ETH, XRP, ZEC, TFUEL, YFI, QTUM—Technical Analysis June 10
Bitcoin (BTC) created a bullish engulfing candlestick on June 9. There are Fib resistance levels at $41,400, $44,900, and $48,400 The post BTC, ETH, XRP, ZEC, TFUEL, YFI, QTUM—Technical Analysis June 10 appeared first on BeInCrypto. дальше »
2021-6-10 16:06 | |
|
|
Bitcoin Daily Dragonfly Doji Gives Bulls Hope Of Sharp Reversal
Bitcoin price is now up $6,000 from yesterday’s low in a flash. A long wick below support is now left behind, forming a Japanese candlestick formation called a dragonfly doji. With a large follow through by crypto bulls already, a daily close above $36,000 could leave a reversal pattern behind on the charts. But to […] дальше »
2021-6-10 21:20 | |
|
|
Stellar Lumens, THETA, Aave Price Analysis: 25 May
A denial above $0.45-resistance could see Stellar Lumens trade towards $0.388 support before the next leg upwards. THETA flashed mixed signals at the time of writing. A bearish marubozu candlestick hiThe post Stellar Lumens, THETA, Aave Price Analysis: 25 May appeared first on AMBCrypto. дальше »
2021-5-26 23:00 | |
|
|

Price analysis 5/13: BTC, ETH, BNB, ADA, DOGE, XRP, DOT, BCH, LTC, UNI
Bitcoin remains on slippery ground and the completion of a bearish candlestick pattern signals that further downside is possible for BTC and altcoins. дальше »
2021-5-14 22:51 | |
|
|

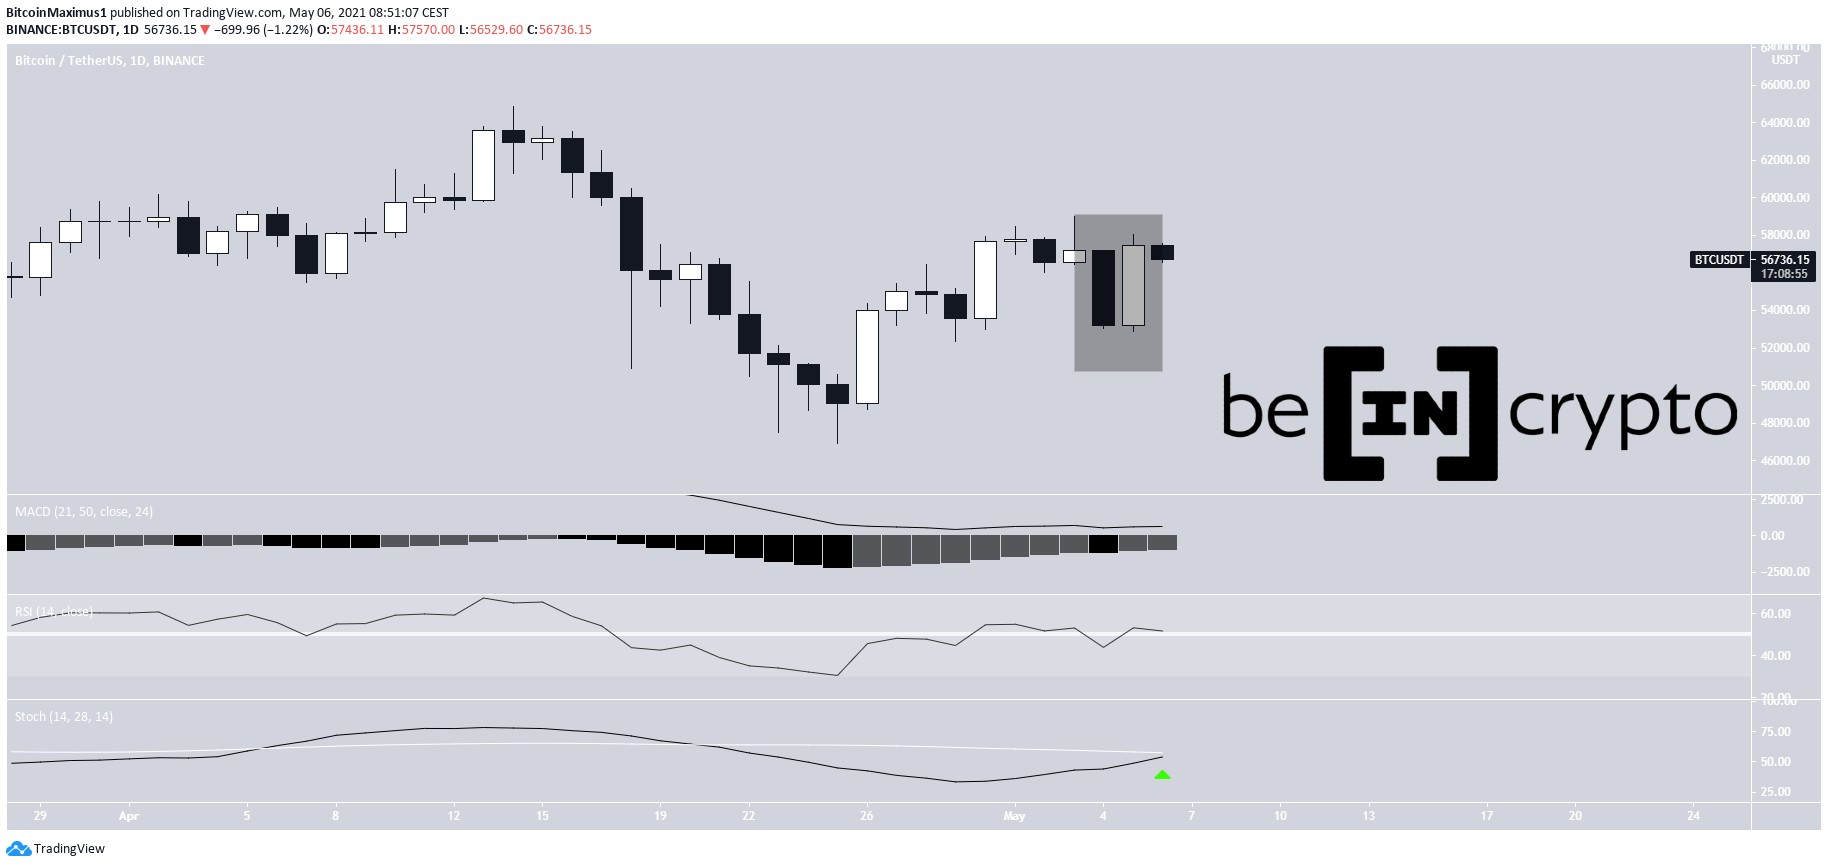
BTC, ETH, XRP, TRX, EOS, XVG, SUSHI—Technical Analysis May 6
Bitcoin (BTC) bounced at the $53,000 support area on May 5, creating a bullish engulfing candlestick in the process. The post BTC, ETH, XRP, TRX, EOS, XVG, SUSHI—Technical Analysis May 6 appeared first on BeInCrypto. дальше »
2021-5-6 14:06 | |
|
|
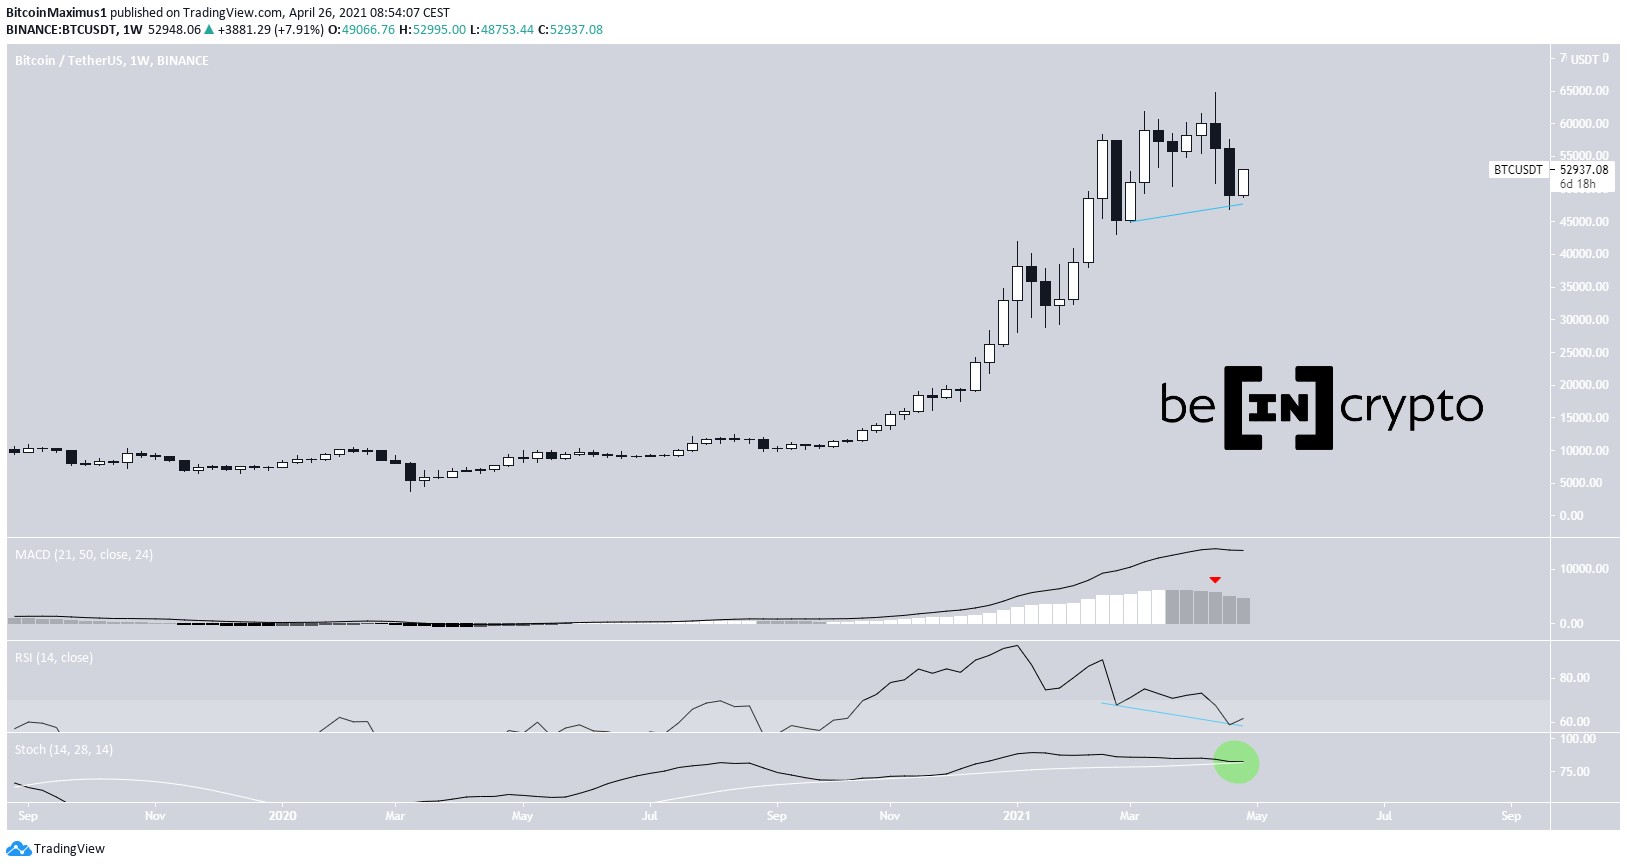
What Changed in Crypto Markets While You Were Sleeping — April 26
Bitcoin update Last week, BTC completed its second successive bearish candlestick. This led to a low of $46,930 being reached on April 25. The price has recovered slightly since then. Technical indicators are mixed. дальше »
2021-4-26 11:14 | |
|
|
Bitcoin (BTC) Bounces Back, Reclaims Important $50,000 Level
Despite the ongoing bounce, there are no clear bullish reversal signs for bitcoin. Therefore, it’s possible that another low will be reached prior to a reversal. Weekly bitcoin price movement Last week, BTC completed its second successive bearish candlestick. дальше »
2021-4-26 10:50 | |
|
|

TEZOS Bounces Above Long-Term Support
While XTZ is still trading above horizontal and diagonal support, the direction of the trend is unclear. Long-term XTZ drop On April 17, XTZ reached a new all-time high (ATH) price of $7. 67. However, it dropped shortly afterwards, creating a bearish doji candlestick. дальше »
2021-4-23 16:30 | |
|
|
What Changed in Crypto Markets While You Were Sleeping — April 5
Bitcoin (BTC) update After creating a hanging man candlestick the week prior, BTC created a small bullish candlestick this week. Technical indicators are showing weakness. The MACD has created a lower momentum bar and the RSI is decreasing, nearly crossing below 70. дальше »
2021-4-5 10:19 | |
|
|
Bitcoin (BTC) Struggles to Find Support Amid Retracement
Bitcoin is expected to find a short-term bottom soon and resume its upward movement. Weekly BTC Close After creating a hanging man candlestick the week prior, BTC created a small bullish candlestick this week. дальше »
2021-4-5 09:27 | |
|
|
Bitcoin (BTC) Completes Correction with Short-Term Breakout
The BTC price has increased nearly 15% since March 25. Bitcoin Resumes Bounce BTC has been moving upwards since March 25, when it bounced at the $50,250 support area. On March 29, it created another bullish candlestick, reaching a high of $58,405. дальше »
2021-3-30 11:25 | |
|
|
Bitcoin (BTC) Bounces Back, Aiming for Higher Prices
Bitcoin is expected to break out from the current short-term descending parallel channel. A short-term decrease could transpire prior to the breakout. Weekly Outlook for BTC The weekly chart shows that BTC created a hanging man candlestick last week. дальше »
2021-3-29 11:01 | |
|
|
Bitcoin (BTC) Bounces but Fails to Clear Resistance
Nevertheless, Bitcoin is expected to either bounce upwards or consolidate this week. After that, it’s expected to confirm the direction of the longer-term trend. Weekly Bitcoin Close Two weeks ago, Bitcoin decreased considerably and created a bearish engulfing candlestick. дальше »
2021-3-8 12:02 | |
|
|
Bitcoin (BTC) Recovers for Another Attack on $50,000
Bitcoin is expected to eventually be successful in reclaiming this level and continue moving upwards. Bitcoin in Recovery After bouncing on March 1, BTC decreased slightly the next day. It created a small bearish candlestick in what looks like a regular retracement in response to the previous increase. дальше »
2021-3-3 11:00 | |
|
|
Bitcoin (BTC) Stops Bleeding with Bounce from Support
It’s possible that this is the beginning of an upward move that will carry Bitcoin above the current resistance range of $50,650-$52,450. Bitcoin Bounces at Support On Mar. 1, Bitcoin bounced at the minor $44,600 support area and created a bullish engulfing candlestick, reaching a high of $49,790. дальше »
2021-3-2 09:39 | |
|
|
Bitcoin (BTC) Bounces Back After Decreasing Below $45,000
Bitcoin is expected to continue increasing towards the resistance areas outlined below. Bearish Weekly Bitcoin Close Bitcoin decreased from a high of $57,508 to a low of $43,000 last week, creating a bearish engulfing candlestick in the process. дальше »
2021-3-1 10:02 | |
|
|
NEO Bounces and Aims For Higher Prices
NEO should continue increasing towards the long-term $77 resistance area and potentially move higher. Current Movement The weekly chart shows that despite the ongoing decline, NEO may create a very long lower wick, resulting in a relatively bullish candlestick before the weekly close. дальше »
2021-2-24 18:10 | |
|
|
Bitcoin Locks in New High — Can it Reach $60,000?
Bitcoin is expected to regain its footing and continue its ascent towards $55,000. Bitcoin Breaks Out Yet Again On Feb. 17, BTC created a bullish belt hold candlestick, reaching a new all-time high price of $52,618. дальше »
2021-2-18 11:35 | |
|
|
Bitcoin Touches $51,000 in a Robust Comeback
While Bitcoin is likely in the final portion of the upward move, it could increase all the way to $55,000 before correcting. Bitcoin Breaks Through $50,000 On Feb. 15, BTC created a hanging man candlestick, which can be read as a sign of weakness when coming in an upward trend. дальше »
2021-2-17 11:48 | |
|
|
Litecoin (LTC) Regains Footing, Aims for Higher-Highs
Despite the rejection, the Litecoin trend still looks bullish. The price is expected to make another breakout attempt in the near future. Long-Term Litecoin Resistance Levels Litecoin increased considerably over the past week, creating a bullish candlestick to reach a high of $230. дальше »
2021-2-16 14:46 | |
|
|
Bitcoin (BTC) Falls Back After Reaching New All-Time High
Despite the drop, it is still likely that the Bitcoin trend is bullish and the price will continue higher. Bitcoin Shows Weakness During the week of Feb. 8-15, the BTC price created a bullish candlestick in the weekly time-frame, reaching an all-time high price of $49,707 on Feb. дальше »
2021-2-15 11:34 | |
|
|
Bitcoin Makes New All-Time High and Nearly Reaches $50,000
While the trend has begun to show signs of weakness, it is likely that BTC will complete another upward move before correcting. Bitcoin Daily Movement On Feb. 11, BTC increased slightly, creating a bullish engulfing candlestick in the process. дальше »
2021-2-12 12:13 | |
|
|
XRP, Algorand, Zcash Price Analysis: 10 February
At the time of writing, XRP was projected to maintain its ascension as buying activity picked up on the charts. On the other hand, Algorand moved lower after a bearish marubozu candlestick formed on iThe post XRP, Algorand, Zcash Price Analysis: 10 February appeared first on AMBCrypto. дальше »
2021-2-10 20:00 | |
|
|
Bitcoin (BTC) Consolidates After All-Time High Breakout
While the possibility of a short-term drop remains, Bitcoin is expected to continue increasing in the near future. Current Bitcoin Movement After breaking out amid a massive bullish candlestick on Feb. дальше »
2021-2-10 11:17 | |
|
|
Bitcoin Shows Bearish Signs with Failed Breakout
Bitcoin is likely still correcting and is expected to eventually drop towards $26,000. Weekly Bitcoin Outlook After two consecutive bearish weekly candlesticks, BTC managed to create a neutral Doji candlestick last week, which also had a slightly bullish close. дальше »
2021-2-1 11:04 | |
|
|
Bitcoin Double Bottom Leads to Hefty Bounce
Bitcoin is expected to resume its upward movement until it reaches the neighborhood of $35,130. Bitcoin Runs Into Resistance Bitcoin initiated a considerable upward movement on Jan. 28, creating a bullish candlestick that completely engulfed the prior bearish candle. дальше »
2021-1-29 09:44 | |
|
|
Bitcoin (BTC) Continues Consolidation Phase Below Resistance
The direction of the short-term Bitcoin trend is not clear, but a bounce toward the $33,700 area seems like the most likely scenario. Bitcoin Continues Indecision After the rejection on Jan. 25, BTC showed some strength in creating a candlestick with a long lower wick and a slightly bullish close. дальше »
2021-1-27 11:39 | |
|
|
Bitcoin Consolidates Above $35,000 Support
Nevertheless, Bitcoin is still trading above short/medium-term support, failing to confirm the bearish trend reversal. Bitcoin Hanging Man Candle During the week of Jan 11-18, Bitcoin created a hanging man candlestick, which is normally considered a bearish reversal sign when appearing during an upward trend. дальше »
2021-1-18 11:15 | |
|
|
Bitcoin Continues Clawing Its Way Toward $40,000
Despite a lack of weakness from technical indicators, the wave count suggests that Bitcoin is nearing the top of its move, with a possible target near $39,100. Bitcoin Reaches Another All-Time High BTC created yet another bullish candlestick on Jan. дальше »
2021-1-7 11:32 | |
|
|
Bitcoin (BTC) Knocking on the Door to $30,000
The rally has begun to show short-term signs of weakness and BTC is expected to soon reach a top. New Bitcoin All-Time High Bitcoin continued its ascent on Dec. 30, creating a bullish candlestick and reaching a high of $28,996. дальше »
2020-12-31 10:47 | |
|
|
Bitcoin Continues Consolidating Above $26,000
Despite there being a lack of a bullish structure, Bitcoin has managed to hold on well above support. Bitcoin Weakness Could Lead to Drop BTC followed up a shooting star candlestick from Dec. 27 by creating a small bullish candlestick the next day. дальше »
2020-12-29 10:46 | |
|
|
Bitcoin Readies for Another Attempt at Making New Highs
Bitcoin is expected to break out from the current resistance and reach a new all-time high in the process. Possible Bitcoin Breakout On Dec. 25, the BTC price continued its consolidation just below the $23,950 resistance area, creating a bullish candlestick. дальше »
2020-12-25 12:45 | |
|
|
Bitcoin Consolidates Below $24,000 After Bullish Weekend Rally
BTC is currently consolidating just below $24,000 and is expected to break out once more. Bitcoin Long-Term Movement During the week of Dec 14-21, BTC created a massive bullish candlestick, convincingly breaking through the $19,500 area to reach a high of $24,295. дальше »
2020-12-21 11:37 | |
|
|
Bitcoin Short-Term Breakout May Create Another Opportunity to Overtake $20,000
Bitcoin is expected to continue increasing towards the targets given in this analysis. Bitcoin Creates Long-Term Double Top During the week of Dec 1-7, the BTC price created a small bullish candlestick which briefly took it to a new all-time high of $19,888 on Dec. дальше »
2020-12-7 13:38 | |
|
|
Chainlink (LINK) Falls Putting Bullish Structure In Doubt
If the price were to break down from the longer-term channel, it would likely confirm that the trend is bearish and the price is heading lower. LINK Long-Term Rejection During the week of Nov. 23-30, the LINK price created a small-bodied bearish candlestick with wicks on each side. дальше »
2020-12-1 16:22 | |
|
|
Bitcoin Recovers After Sharp Drop Below Support
Bitcoin has been moving upwards since the drop, but it is more likely that the increase is a retracement rather than the beginning of a new upward trend. Bitcoin Doji Candle Shows Indecision During the week of Nov 23-30, Bitcoin created a long-legged Doji candlestick which had a bearish close. дальше »
2020-11-30 13:11 | |
|
|
Litecoin Searching for Support After Falling from 2020 High
Despite the drop, Litecoin is expected to find support soon and move towards the resistance areas outlined below. Litecoin Rejected from Long-Term Resistance During the week of Nov. 16-23, the LTC price increased considerably, creating a bullish candlestick that took the price to the $85 resistance area. дальше »
2020-11-28 14:51 | |
|
|
Bitcoin Still Hunting for a Bottom After Losing Support
The downward move is expected to continue until Bitcoin reaches at least one of the key support levels outlined below. Support Levels For Bitcoin On Nov. 27, BTC created a massive bearish candlestick, dropping from a high of $18,911 to a low of $16,218. дальше »
2020-11-27 13:10 | |
|
|
Bitcoin Hunts for New All-Time High After Sweeping Range Lows
Bitcoin in a Symmetrical Triangle The BTC price has been trading inside a symmetrical triangle since reaching a high of $18,977 on Nov. 21. Today, the price dropped to the support line of the triangle and created a long lower wick and a hammer candlestick, a sign of buying pressure. дальше »
2020-11-24 12:24 | |
|
|
ADA Breaks Out and Touches New Yearly High
Long-Term Breakout The ADA price broke out from the $0. 10 resistance area at the beginning of July. The price returned to validate this level as support. After a period of consolidation, ADA created a massive bullish candlestick during the week of Nov 15-22, increasing by 45%. дальше »
2020-11-24 22:13 | |
|
|
Bitcoin Begins to Stall After Parabolic Ascent
After a parabolic increase, the BTC price stalled and created a Spinning Top candlestick on Nov 18. The price has begun to show signs of weakness, but a breakdown is not yet confirmed. Bitcoin Follows Parabolic Support The Bitcoin price has been following a parabolic ascending support line since the beginning of September. дальше »
2020-11-20 12:11 | |
|
|
Bitcoin Adds 10% In a Day, Reaches Long-Term Resistance
The Bitcoin (BTC) price created a bullish engulfing candlestick on Nov 5, reaching a high of $15,570 to mark a 10% gain for the day. While the price has reached an important resistance area that could act as the top, there are no signs of weakness yet in the trend. дальше »
2020-11-6 12:44 | |
|
|
Bitcoin Continues Ascent, Invalidating Numerous Divergences
The Bitcoin (BTC) price has continued its ascent by creating yet another bullish candlestick on Nov 4. The movement has invalidated numerous bearish divergences, and the price seems to be targeting a long-term resistance level. дальше »
2020-11-5 13:04 | |
|
|
VeChain candlestick pattern suggests VET ready to explode above $0.015
VeChain is ready to explode above a key resistance level VeChain (VET) could see... The post VeChain candlestick pattern suggests VET ready to explode above $0.015 appeared first on Coin Journal. дальше »
2020-10-24 12:59 | |
|
|
Bitcoin Touches New 2020 High Above $13,000 – What’s Next?
On Oct 22, Bitcoin (BTC) continued its ascent by creating a massive bullish engulfing candlestick and breaking out above the $12,050 resistance area. While short-term retracements could occur, it is likely that Bitcoin’s trend is still bullish. дальше »
2020-10-23 11:42 | |
|
|
Bitcoin Sprints Past $12,000 Returning to August Highs
On Oct 20, Bitcoin (BTC) created a bullish engulfing candlestick and proceeded to move above an important resistance area. A daily close above the $12,050 area would be a significant bullish sign, while a weekly close above the current level would be an even more considerable signal for continuation to new 2020 highs. дальше »
2020-10-21 11:43 | |
|
|
XRP Shows Signs of Life With 7% Daily Bounce
The XRP price increased by more than 7% on Oct 4, creating a bullish engulfing candlestick in the process. While the price has yet to break out above the main resistance area, technical indicators and the price action suggest it will do so soon. дальше »
2020-10-5 20:39 | |
|
|