2023-9-8 20:46 |
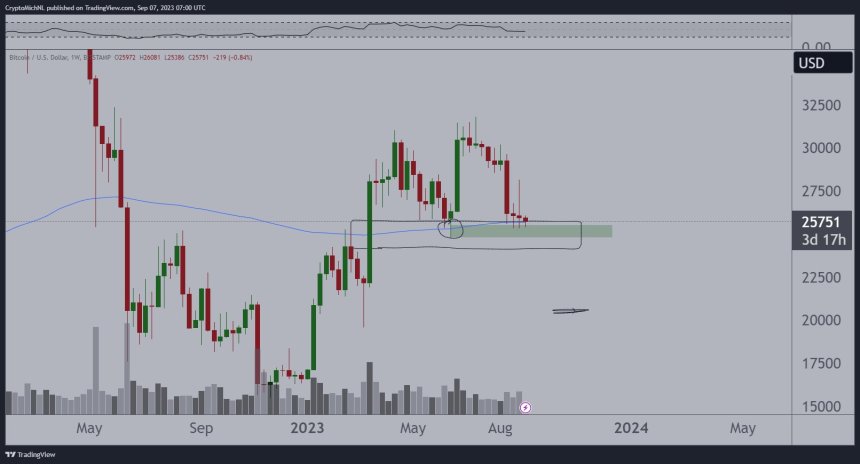
Bitcoin (BTC) has officially dipped below the $26,000 level and is currently trading at $25,800, which coincides with its 200-week Exponential Moving Average (EMA). This EMA has served as a crucial support level, as it played a role in Bitcoin’s rebound on June 15, leading to its yearly high of $31,800.
Bitcoin Consolidation ConundrumThe current situation appears to be slightly different for BTC. On the one hand, Bitcoin has been experiencing an extended consolidation phase just above this significant level for over seven days.
More concerning is that the cryptocurrency has been forming lower lows during this consolidation, indicating a downward pressure trend.
Moreover, during Bitcoin’s rally on June 15, it had the advantage of holding its key 200-day Moving Average (MA), which has been influential in determining its prospects and upward gains. However, this same moving average presents a potential hurdle for BTC, acting as a resistance at the $27,100 level, potentially impeding a recovery rebound.
As highlighted by crypto market analyst Michael Van De Poppe, the crucial question is whether Bitcoin will maintain its position above the 200-week EMA.
Abnormally Low Trading Volume In Spot Market Raises ConcernsOn this matter, CryptoQuant author and crypto analyst Maartunn has identified an intriguing phenomenon in the BTC market that may shed light on the cryptocurrency’s recent stagnant state and low volatility.
Maartunn has observed an abnormal pattern: the trading volume in the Bitcoin-spot market has reached its lowest level since 2017. This finding has significant implications for understanding the dynamics of BTC’s price and market behavior.
The Bitcoin spot market plays a crucial role in the cryptocurrency ecosystem. It is where investors and traders buy and sell actual Bitcoins for immediate delivery instead of derivative products or futures contracts.
Spot market trading volume reflects the level of participant activity and liquidity in the market, providing insights into the supply and demand dynamics of Bitcoin.
The unusually low trading volume in the BTC-spot market suggests decreased market activity and engagement among traders.
This lack of participation can contribute to stagnation and low volatility in BTC’s price. With fewer buyers and sellers entering the market, there may be limited price movement and a reduced likelihood of significant price swings.
Such conditions can have implications for investors and traders. Low volatility may discourage short-term speculative trading strategies as the potential for quick profits diminishes.
Additionally, it may indicate a lack of market confidence or uncertainty among participants, leading to a cautious approach and potential hesitation in making significant investment decisions.
Monumental First Half Of 2024 For BTC?According to crypto analyst Miles Deutscher, the first half of 2024 is shaping to be a monumental period for the cryptocurrency market. Several key events and deadlines are anticipated during this timeframe, which could profoundly impact the industry and its major players.
Starting in January through March, the spotlight will be on Bitcoin as the final deadline for approving the Bitcoin spot exchange-traded funds (ETFs) approach.
The crypto community has long awaited the introduction of a Bitcoin ETF as it could potentially open the doors for broader institutional participation and investment in the digital asset.
In May, another highly anticipated event is the Bitcoin halving. This recurring event, which occurs approximately every four years, reduces the rate at which new Bitcoins are generated.
In June, the focus shifted to the Federal Reserve (FED) and its potential decision to cut interest rates. While market pricing currently suggests the likelihood of a rate cut, such a move could have implications for the broader financial landscape, including the cryptocurrency market.
Featured image from iStock, chart from TradingView.com
origin »Bitcoin price in Telegram @btc_price_every_hour
ETH 26 EMA Crossover Yield II (ETHEMAAPY) на Currencies.ru
|
|


