2020-8-5 20:20 |
Powered by
Every week, IntoTheBlock brings you an on-chain analysis of top news stories in the crypto space. Leveraging blockchain’s public nature, IntoTheBlock’s machine learning algorithms extract key data that provide a deeper dive into the major developments in the industry.
This week, we provide analytics into the flash crash that affected top cryptoassets during the weekend. Specifically, we look at its implications in on-chain and derivatives indicators for Bitcoin and Ethereum. As well, we cover the progress being made by Synthetix, a DeFi protocol with eye-popping returns for its native token.
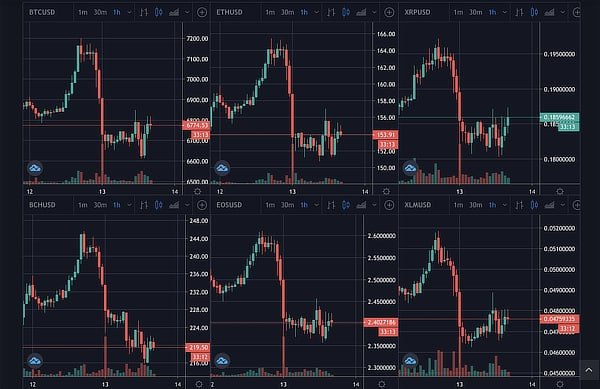
Insights Behind the Weekend Flash CrashAs covered in Forbes, Bitcoin crashed 12% within minutes early on Sunday morning. Along with it — due to high correlations — the prices of most other cryptoassets experienced even larger drops, with Ether falling by over 25% within 15 minutes. Prices of most cryptoassets recovered shortly after and have continued climbing since.
Sudden price movements like these are often attributed to whales selling. While this may be the case, it is likely that the trading activity causing this crash was due to high leverage on spot markets. We can determine that this is the case by analyzing on-chain transactions over $100,000.
IntoTheBlock’s large transaction volume indicator aggregates the total amount transferred in transactions over $100,000 in a 24-hour period, and acts as a proxy to whale trading activity. As can be seen in the graph below, the large transaction volume experienced during the flash crash was relatively underwhelming at $3.64 billion, a seven-day low.
While large transaction volumes do tend to drop in the weekends, this is remarkably low volume taking into account the large intra-day volatility experienced. This points to the likelihood that the actors causing the flash crash were leveraged within a spot exchange rather than transacting on-chain since there was barely any effect on blockchain large transaction data.
Most other cryptoassets were hit even harder by the flash crash, despite recovering a significant percentage of the losses shortly after. This is a result of the high correlation between Bitcoin and most cryptoassets. In ETH’s case for instance, the 30-day correlation is currently at a correlation coefficient of 0.96. For context, a correlation coefficient of 0.5 already implies a high positive correlation, meaning that Ethereum’s 0.96 30-day correlation indicates a very strong statistical relationship between the prices of the two.
As of August 3 at 6PM using IntoTheBlock’s Ethereum Correlation to BTCAs can be seen from the image above, the correlation between ETH and BTC has been on an upward trend since mid-July, pointing to both moving increasingly in tandem with each other. Since most traders are aware of these correlations, the impact of flash crashes such as the one seen on Sunday tends to be exacerbated in altcoins, especially in those that are less liquid and have lower market caps.
While on-chain metrics for Bitcoin were not severely affected by the flash crash, Ethereum did see a noticeable upsurge on its blockchain activity. As reported by Decrypt, Coinbase experienced delays in Ethereum and ERC-20 deposits and withdrawals following the sudden drop in price. This was a result of a spike in network activity causing fees to more than double within minutes. As a result, daily active addresses in Ethereum reached a two-year high of over 620,000 unique addresses.
As of August 3 at 6PM using IntoTheBlock’s Ethereum Addresses StatsWhile part of this growth in active addresses can be attributed partly to trading activity throughout the flash crash, it is also important to note the increased demand to use dapps built on top of Ethereum as discussed in this piece.
Similarly, Ethereum derivatives had a significant uptick in activity throughout the flash crash. Perpetual swaps — which have quickly become the industry’s leading type of derivative contract — recorded an all-time high in volume on Sunday.
As of August 3 at 6PM using IntoTheBlock’s Ethereum Perpetual SwapsAs can be seen in the graph above, ETH perpetual swaps volume almost reached $9 billion on August 2. This amount is remarkably high when considering that the aggregate daily volume for ETH perpetuals was under $1 billion less than two weeks ago.
Overall, analyzing the flash crash, we can establish that most cryptoassets are still highly correlated to Bitcoin. The lack of impact in on-chain Bitcoin transactions points to the likelihood of the culprit being leveraged positions in spot exchanges rather than whales selling their positions. While Ethereum did see a spike in daily active addresses, the impact felt in its perpetual swaps volume was much stronger, pointing to the high appetite for risk and leverage in the derivatives market.
Synthetix Hits New All-Time High Following DAO RestructuringIt is no secret that DeFi tokens have been hot property in crypto markets this year. Along with the hype surrounding liquidity mining (aka yield farming) and protocol upgrades, DeFi token prices have skyrocketed. One of the protocols leading this wave of excitement towards DeFi is the decentralized derivatives protocol Synthetix.
Synthetix’s native token SNX is used in the Synthetix ecosystem as collateral to back derivatives contracts in its exchange. In return for supplying SNX, users receive a share of the fees spent in the Synthetix exchange as staking rewards, which are claimed on a weekly basis as long as users’ collateralization ratio remains above 750%. This incentivizes the creation of derivative products, or synths, and active participation of users in the Synthetix ecosystem. A more detailed description of the mechanics of Synthetix can be found in this piece.
As users of Synthetix exchange have grown, its token has seen remarkable returns. While SNX is “only” up 4x year-to-date, it has increased by over 14x from its March bottom. This has led SNX to break all-time highs week after week, closing above the $4 mark for the first time a few days ago. Prior to hitting the recent all-time high of $4.50, the Synthetix team announced through its blog that it will be decentralizing itself.
Effective immediately, the Synthetix ecosystem is governed by three different distributed autonomous organizations (DAOs) through which community members can participate in decision-making and even receive funding for contributions. Following the announcement, price rebounded from the recent drop. While price increased by over 15% on that day, the large transaction volume actually dropped to the lowest level that week, below $1 million.
As of August 4 at 9PM using IntoTheBlock’s Synthetix’s Large TransactionsAs can be seen in the graph above, large transactions peaked above $20 million in early July and have stagnated since. This points to the recent rally being fueled by retail investors, rather than institutional ones.
Similarly, daily active addresses for SNX have trended sideways after hitting an all-time high in early July. As shown in the graph below, daily active addresses had moved in tandem with SNX’s price but their paths have begun to diverge.
As of August 4 at 9PM using IntoTheBlock’s Synthetix’s Addresses StatsThis divergence is likely due to more of its trading activity happening off-chain in centralized exchanges. Given the recent trend towards DeFi tokens, SNX was recently listed on major exchanges such as Binance and OKEx. However, since over 60% of the SNX remains staked in the Synthetix protocol, SNX remains relatively illiquid as holders are opting to earn staking rewards rather than keeping their tokens in exchanges.
While this fact — along with an ambitious updated roadmap — has generated high expectations for Synthetix, it is important to keep in mind that prices may be due a correction given that it has increased by over 5x in less than two months. Readers are encouraged to do their own research and use IntoTheBlock’s indicators to obtain a better understanding of the growth behind the Synthetix protocol.
This article contains links to third-party websites or other content for information purposes only (“Third-Party Sites”). The Third-Party Sites are not under the control of CoinMarketCap, and CoinMarketCap is not responsible for the content of any Third-Party Site, including without limitation any link contained in a Third-Party Site, or any changes or updates to a Third-Party Site. CoinMarketCap is providing these links to you only as a convenience, and the inclusion of any link does not imply endorsement, approval or recommendation by CoinMarketCap of the site or any association with its operators.
This article is intended to be used and must be used for informational purposes only. It is important to do your own research and analysis before making any material decisions related to any of the products or services described. This article is not intended as, and shall not be construed as, financial advice.
The views and opinions expressed in this article are the author’s own and do not necessarily reflect those of CoinMarketCap.
The post Inside the Flash Crash & DeFi’s Most Recent All-Time High appeared first on CoinMarketCap Blog.
origin »Bitcoin price in Telegram @btc_price_every_hour
High Voltage (HVCO) на Currencies.ru
|
|