Новости о Pattern Chart [ Фото новости ] [ Свежие новости ] | |

Ripple (XRP) Price Analysis: Still Far from Bottoming Out?
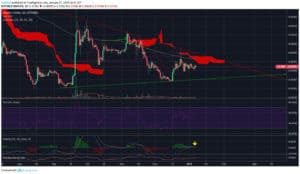
Ripple broke below its short-term consolidation pattern to signal that a continuation of the longer-term slide is due. Price is trading inside a descending channel visible on the 4-hour chart and has just tumbled below the mid-channel area of interest. дальше »
2019-1-30 05:18 | |
|
|
Wikipedia Page Views Suggest Bitcoin Remains the Most Popular Crypto: ETH, BAT and XRP Next
The cryptocurrency market moves up and down in a way that traditional finance does not, but the pattern has been hard to predict for a while. A recent Twitter post by DataLight urged consumers to examine the Wikipedia views for the different coins. дальше »
2019-1-26 16:58 | |
|
|
Fractal Pattern Analysis Indicates Bitcoin Could Fall to $2,500 Before Recovery
Chart and pattern analysis has been widely used to try to predict when Bitcoin and crypto markets will hit the bottom. A huge range of technical indicators combined with historical snapshots are put to work in order to tell us when the optimum time to get back in is. дальше »
2019-1-24 12:00 | |
|
|
Bitcoin Price Weekly Analysis: BTC’s Bullish and Bearish Scenarios Analyzed
Bitcoin price declined recently and traded below the $3,725 support against the US Dollar. There is a short term breakout pattern forming with resistance near $3,650 on the 4-hours chart of the BTC/USD pair (data feed from Kraken). дальше »
2019-1-13 09:00 | |
|
|
Ripple Price Analysis: XRP Eyeing Upside Break Above $0.37
Ripple price tested the key support near $0. 3600 and later recovered against the US dollar. There is a crucial breakout pattern forming with resistance at $0. 3680 on the hourly chart of the XRP/USD pair (data source from Kraken). дальше »
2019-1-9 08:00 | |
|
|
Cardano (ADA) Price Analysis: Major Reversal Pattern Formed
Cardano could be due for a huge reversal from its previous long-term slide as an inverse head and shoulders pattern has formed on its 4-hour time frame. Price has yet to break past the neckline resistance at the 0. дальше »
2019-1-8 07:27 | |
|
|
Bitcoin (BTC) Price Analysis: Revisiting Support at $4,000
Bitcoin is still consolidating in its triangle pattern visible on the 4-hour chart after recently getting rejected at $4,200. Price looks ready for another test of support that lines up with several potential inflection points. дальше »
2019-1-8 07:16 | |
|
|
Price Analysis: Bitcoin, Ethereum, XRP, Stellar, Litecoin, Cardano, EOS, IOTA, Tron, and Dogecoin
Bitcoin [BTC] Price Analysis: A look at the Daily chart for Bitcoin shows that price is currently trading at the $4100 level. Price is trying to make a reverse head and shoulders pattern with a neckline at $4440, coinciding with the 0. дальше »
2019-1-8 21:39 | |
|
|
Ethereum Price Analysis: ETH’s Bullish Extension Above $150
Key Highlights ETH price climbed higher sharply and broke the $150 resistance area against the US Dollar. There is a short term bullish flag pattern formed with support at $150 on the hourly chart of ETH/USD (data feed via Kraken). дальше »
2019-1-3 07:08 | |
|
|
Bitcoin (BTC) Price Analysis: Another Breakout To Look Out For
Bitcoin has also formed a triangle chart pattern which might show an earlier breakout as a preview for its reversal formation. Price has bounced off the triangle bottom and might be due for a test of resistance at the $4,200 mark next. дальше »
2019-1-3 06:06 | |
|
|
Bitcoin (BTC) Price Analysis: Larger Reversal Pattern Forming
Bitcoin might be ready for a longer-term climb as it forms an inverse head and shoulders pattern on its 4-hour time frame. Price has yet to test and break past the resistance but if it does, bitcoin could be in for a climb that’s the same height as the chart formation. дальше »
2019-1-2 05:10 | |
|
|
Bitcoin Price Watch: BTC Primed To Gain Bullish Momentum
Key Points Bitcoin price recently tested the $3,950-4,000 resistance area against the US Dollar. There is a key breakout pattern in place with resistance at $3,800 on the hourly chart of the BTC/USD pair (data feed from Kraken). дальше »
2018-12-31 09:00 | |
|
|
Ripple Price Analysis: XRP Poised For Next Bullish Break Above $0.40
Key Highlights Ripple price is currently consolidating gains below the key $0. 3900-0. 4000 resistance against the US dollar. There is a key breakout pattern forming with resistance near $0. 3840 on the hourly chart of the XRP/USD pair (data source from Kraken). дальше »
2018-12-21 08:00 | |
|
|

Bitcoin Price Analysis: Strong Rally Tests Overhanging Resistance
Earlier this week, bitcoin enjoyed a strong and quick rally, spanning all the way from the low $3,100s to the upper $3,900s — in other words, a move that previously took the market weeks to make, this time took place in just a few short days. дальше »
2018-12-20 02:21 | |
|
|
Bitcoin SV Price Analysis: BSV/USD Trends of December 12–18
CoinSpeaker Bitcoin SV Price Analysis: BSV/USD Trends of December 12–18 “Double bottom” pattern was formed as it is clearly seen on the chart which indicates that BSV price may hit $92 price level in which if the level is broken the coin may have its high at $96 price level. дальше »
2018-12-12 15:38 | |
|
|
Bitcoin (BTC) Price Analysis: Short-Term Falling Wedge Pattern
Another consolidation pattern can be spotted on bitcoin as price is moving inside a falling wedge on its short-term chart. Price is down to support and might be due for yet another bounce to the top around $3,800. дальше »
2018-12-6 06:35 | |
|
|
Cardano Price Analysis: ADA/USD Remains Supported Above $0.035
Key Highlights ADA price topped near the $0. 0440 level and later corrected lower against the US Dollar (tethered). There is a major breakout pattern in place with resistance at $0. 0430 on the hourly chart of the ADA/USD pair (data feed via Bittrex). дальше »
2018-12-3 11:28 | |
|
|
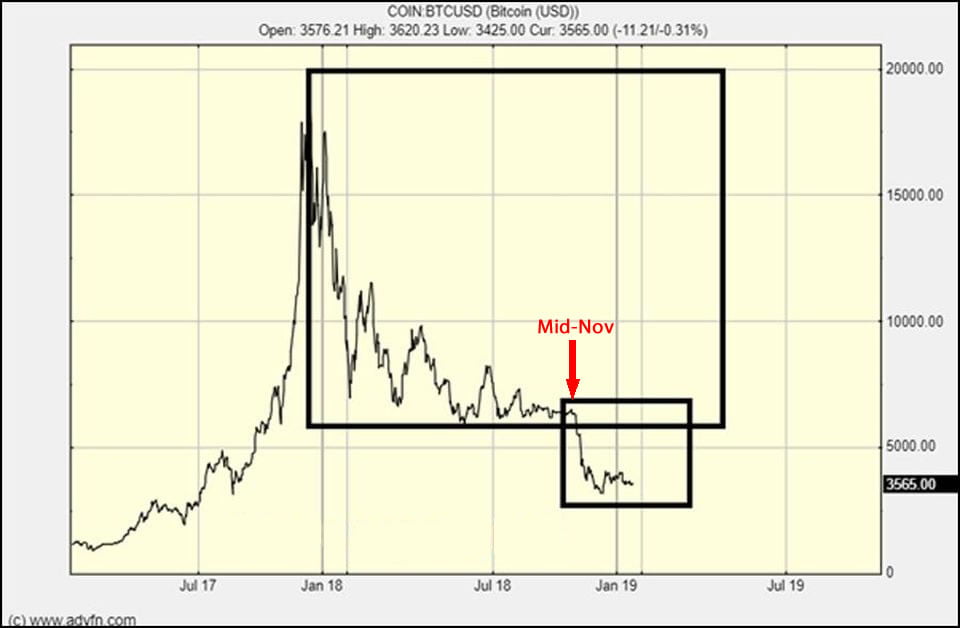
Bitcoin Price Weekly Analysis: Sell Rallies In BTC/USD Near $5,880
Key Points Bitcoin price declined heavily and traded close to the $5,200 support level against the US Dollar. There is a short term consolidation pattern formed with resistance at $5,550 on the 4-hours chart of the BTC/USD pair (data feed from Kraken). дальше »
2018-11-18 09:30 | |
|
|
Ethereum Classic Price Analysis: ETC/USD Tumbles To New 2018 Low
Key Highlights Ethereum classic price declined sharply and broke the $8. 00 and $7. 00 supports against the US dollar. There is a short term consolidation pattern forming with resistance at $7. 70 on the hourly chart of the ETC/USD pair (Data feed via Kraken). дальше »
2018-11-15 09:28 | |
|
|
Bitcoin (BTC) Price Analysis: Strong Downside Break, How Low Can It Go?
Bitcoin had formed lower highs and higher lows to consolidate inside a symmetrical triangle on its 4-hour time frame before breaking to the downside. This signals that bears have won over and that further declines are underway. дальше »
2018-11-15 06:24 | |
|
|
Altcoins Price Analysis: Every Dip a Buying Opportunity in XLM/USD and ADA/USD
After solid gains, altcoins are slowing down but not bearish. From the chart we can see that ADA/USD and XLM/USD pairs are trending higher within a bullish break out pattern. At the same time, LTC/USD is down while EOS/USD is flat despite release of EOSIO 1. дальше »
2018-11-9 05:00 | |
|
|
Ethereum Price Analysis: ETH/USD Breaks Key Resistance, $230 Next?
Key Highlights ETH price traded higher and broke the $215 and $220 resistance levels against the US Dollar. Yesterday’s highlighted key breakout pattern was breached with resistance at $208 on the hourly chart of ETH/USD (data feed via Kraken). дальше »
2018-11-7 07:28 | |
|
|
Ethereum Price Analysis: ETH/USD Primed For More Gains
Key Highlights ETH price tested the $205 support area and recovered later against the US Dollar. There is a major breakout pattern formed with resistance at $209 on the hourly chart of ETH/USD (data feed via Kraken). дальше »
2018-11-6 11:28 | |
|
|
Stellar Lumens (XLM) Price Analysis | November 2
XLM/USD Price Medium-term Trend: Bearish Supply levels: $0. 23, $0. 24, $0. 25 Demand level: $0. 22, $0. 20, $0. 16 Stellar continues its bearish trend on the 4-Hour chart. A week ago, XLM formed Head and shoulder pattern in which the neckline was the supply level of $0. дальше »
2018-11-2 13:24 | |
|
|
Ethereum Price Weekly Analysis: ETH/USD Facing Significant Hurdle
Key Highlights ETH price stayed above the $196-197 support area with positive moves against the US Dollar. There is a monster breakout pattern formed with resistance at $204 on the 4-hours chart of ETH/USD (data feed via Kraken). дальше »
2018-10-28 09:28 | |
|
|
Bitcoin Price Watch: BTC/USD Forms Double Bottom Near $6,360
Key Points Bitcoin price declined recently and tested the $6,350-60 support area against the US Dollar. There is a major bearish trend line formed with resistance at $6,410 on the hourly chart of the BTC/USD pair (data feed from Kraken). дальше »
2018-10-25 12:45 | |
|
|
Ripple (XRP) Price Watch: Inverted Head and Shoulders
Ripple Price Key Highlights Ripple might be done with its slide as it forms an inverted head and shoulders reversal pattern on its 4-hour chart. A break above the neckline could confirm that an uptrend of the same height as the chart formation might be in the works. дальше »
2018-10-25 10:00 | |
|
|
Stellar (XLM) Price Analysis: Is That a Reversal Pattern?
Stellar could be in for a rally as it formed an inverted head and shoulders pattern on its 1-hour chart. Price is currently testing the neckline and a break higher could send it up by roughly the same height as the chart formation, which spans 0. дальше »
2018-10-23 06:14 | |
|
|
Ripple Price Analysis: XRP/USD Could Correct Lower To $0.4350
Key Highlights Ripple price failed to stay above the $0. 4600 support and declined recently against the US dollar. There was a break below an ascending triangle pattern with support at $0. 4630 on the hourly chart of the XRP/USD pair (data source from Kraken). дальше »
2018-10-19 10:30 | |
|
|
Ripple Price Analysis: XRP/USD At Major Crossroads Above $0.4600
Key Highlights Ripple price is consolidating above the $0. 4600 support level against the US dollar. There is an ascending triangle pattern formed with resistance at $0. 4740 on the hourly chart of the XRP/USD pair (data source from Kraken). дальше »
2018-10-18 09:28 | |
|
|
Bitcoin (BTC): A Method To The Madness
Bitcoin (BTC) does not just go up and down, breaks supports and resistances based on sudden whims. Most traders are so focused on the 15 min chart that they miss the big picture. They fail to realize that major trading on exchanges is done by algorithmic bots. дальше »
2018-10-15 21:30 | |
|
|
Ethereum Classic (ETC) Can Easily End The Year Above $100
Ethereum Classic (ETC) is highly likely to trade north of $100 by end of the year. This does not require a very bullish Bitcoin (BTC). In fact, if Bitcoin (BTC) trades around $10,000, that would do the job for Ethereum Classic (ETC). дальше »
2018-10-12 17:30 | |
|
|
Ethereum (ETH) Price Watch: Next Downside Targets
Ethereum Price Key Highlights Ethereum broke below its latest consolidation pattern, indicating that losses are in the cards. Price is still trading inside a descending channel on the daily chart and looks ready for a test of support. дальше »
2018-10-12 06:47 | |
|
|
Eos (EOS) Investors Unmoved By Bitcoin (BTC) Selloff
Chart for EOS/USD (1W) Cryptocurrency markets plunge deep in the red, dancing to the tune of Bitcoin (BTC). Eos (EOS) investors are not moved by this confusion. In fact, as the above weekly chart for EOS/USD shows, the price of Eos (EOS) has not corrected the same way as the rest of the market. дальше »
2018-10-11 00:30 | |
|
|
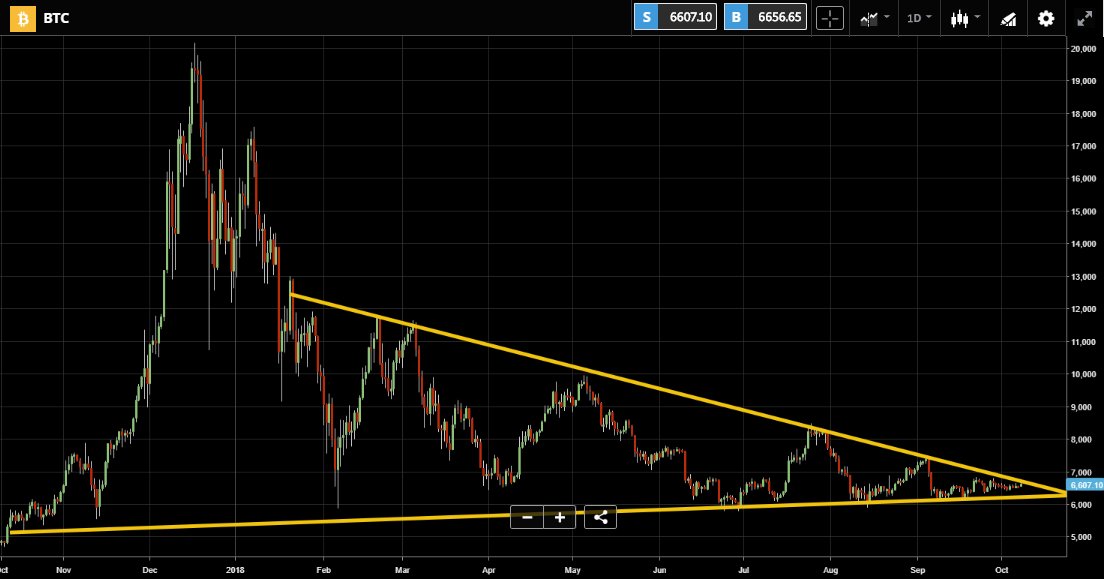
No Bearish Breakdown? Is the Bitcoin Bear Market Coming to a Conclusion?
A breakout has still not occurred in Bitcoin as the triangle pattern approaches its end. On the logarithmic scale chart, price action has actually managed to break out of the pattern and close above, but this also happened earlier in the year and preceded a sharp decline. дальше »
2018-10-10 16:49 | |
|
|
Bitcoin (BTC) Price Watch: Wait for this Short-Term Breakout
Bitcoin Price Key Highlights Bitcoin price has formed lower highs and higher lows on its 1-hour chart to trade inside a symmetrical triangle. Price is currently testing the bottom of the triangle and might be due for a bounce back to the top around $6,700. дальше »
2018-10-10 08:08 | |
|
|
Bitcoin Price Update: Breakout Imminent as Price Looks to Move Beyond Descending Triangle
Bitcoin looks set for an imminent price breakout. The price action chart for the top-ranked cryptocurrency shows a classic breakout pattern which could potentially signal an end to the sideways trading of the last two months. дальше »
2018-10-8 19:45 | |
|
|
Ethereum (ETH): Final Shakeout Or Another Bear Trend?
Ethereum (ETH) seems to have just broken its symmetrical triangle to the downside. This was expected as the price entered the triangle from the upside. Symmetrical triangle being a continuation pattern had a higher chance of breaking to the downside. дальше »
2018-10-7 18:00 | |
|
|
Cardano (ADA) Price Analysis: Trends of October 5–11, 2018
The price has formed a “symmetrical triangle” pattern on the 4-Hour chart. It is currently below the 4-day EMA which has crossed the 50-day EMA downward below the supply zone of $0. 08 inside the symmetrical triangle. дальше »
2018-10-6 17:43 | |
|
|
Ripple Price Analysis: XRP/USD Bullish Above $0.5520
Key Highlights Ripple price is holding the $0. 5500 and $0. 5520 support levels against the US dollar. There is a major breakout pattern formed with resistance at $0. 5820 on the hourly chart of the XRP/USD pair (data source from Kraken). дальше »
2018-10-2 10:30 | |
|
|
EOS/USD Price Analysis: Trends of October 1–7, 2018
The price has formed an “ascending triangle” pattern on the daily and 4-hour chart which suggests the probability for the price increase toward a resistance level of $6.8. The post EOS/USD Price Analysis: Trends of October 1–7, 2018 appeared first on CoinSpeaker. дальше »
2018-10-2 00:15 | |
|
|
Bitcoin (BTC) Compound Fulcrum And Correlation With Copper
Bitcoin (BTC) is printing a pattern which is a very rare sight in the world of technical analysis. This formation seen on the above daily chart for BTC/USD is called a compound fulcrum. It comprises of an inverse head and shoulders and a head and shoulders trading inside a wedge in the order visible above. дальше »
2018-9-28 17:00 | |
|
|
Bitcoin Cash Price Analysis: BCH/USD Dips Remain Supported Above $540
Key Points Bitcoin cash price extended gains above the $550 resistance and traded towards $600 against the US Dollar. There was a break above a bullish pennant pattern with resistance at $522 on the hourly chart of the BCH/USD pair (data feed from Kraken). дальше »
2018-9-28 07:28 | |
|
|
Bitcoin Price Watch: BTC Broke Key Support, Could Test $6,275
Key Points Bitcoin price failed to hold the key support at $6,590 and declined below $6,500 against the US Dollar. There was a break below a bearish pattern with support at $6,550 on the hourly chart of the BTC/USD pair (data feed from Kraken). дальше »
2018-9-25 11:30 | |
|
|
EOS/USD Price Analysis: Trends of September 24–30, 2018
The price has formed a “pennant” pattern on the daily chart which suggests the probability for the price to fall toward support level of $4.1. The post EOS/USD Price Analysis: Trends of September 24–30, 2018 appeared first on CoinSpeaker. дальше »
2018-9-24 19:18 | |
|
|
Bitcoin (BTC) Price Watch: Reversal Pattern Confirmation on SEC Order
Bitcoin Price Key Highlights Bitcoin price looks ready to confirm its double bottom reversal formation as it tests the neckline. A break higher could lead to a rally that’s the same height as the chart formation, which spans $6,100 to $6,650. дальше »
2018-9-21 07:16 | |
|
|
Ethereum (ETH) Price Watch: Still Waiting for a Triangle Breakout
Ethereum Price Key Highlights Ethereum has formed lower highs and higher lows to create a symmetrical triangle pattern on its 1-hour chart. Price is currently bouncing off support and might be due for another test of the top. дальше »
2018-9-20 07:54 | |
|
|
Bitcoin (BTC) Price Analysis: Short-Term Reversal Pattern Forming?
Bitcoin failed in its last two attempts to break below the $6,200 level, creating a double bottom reversal pattern on the 1-hour chart. The post Bitcoin (BTC) Price Analysis: Short-Term Reversal Pattern Forming? appeared first on Ethereum World News. дальше »
2018-9-19 07:13 | |
|
|