Новости о Breaks Above [ Фото новости ] [ Свежие новости ] | |

Litecoin Price Prediction: LTC Got Rejected at $50, Will the Next Attempt Be Successful?
Long-Term Outlook A look at the Weekly chart for Litecoin in logarithmic form shows that price has seemingly found support above the 200-period MA and is trading at $45. Price is trading slightly below the resistance area near $50 and the 50-period MA/Ichimoku cloud. дальше »
2019-2-26 12:59 | |
|
|
Ethereum Price Analysis: ETH Remains Sell Until It Breaks 100 SMA
ETH price corrected a few points after a sharp decline below the $142 support area against the US Dollar. The price corrected above $138, but the previous supports at $141 and $142 prevented gains. дальше »
2019-2-26 07:08 | |
|
|
Ethereum Price Prediction: ETH Breaks Out Above the Daily Ichimoku Cloud, Will It Move Past the 21-week MA?
Long-Term Outlook A look at the Weekly chart for ETH/USD in logarithmic form shows that price has bounced back after finding support in the minor support area near $80. The price is currently slightly below the minor resistance area at $160 and facing very close resistance from the 50-period MA. дальше »
2019-2-20 12:09 | |
|
|

Bitcoin Price Analysis: Consolidation Breaks Out Into Macro Resistance Test
Over the course of the last 10 days, bitcoin has managed to rally nearly 20% in value as it burst through two major resistance levels and is now beginning the test of a major macro level:Figure 1: BTC-USD, Daily Candles, Macro ResistanceWe can see a clear, descending supply-and-demand channel that governed the market for the last two months. дальше »
2019-2-20 01:38 | |
|
|
Bitcoin (BTC) Price Analysis: Reversal Pattern Confirmation, More Upside?
Bitcoin could be due for an even bigger climb as it breaks past the neckline of the complex inverse head and shoulders on the 4-hour time frame. Price is closing above the $3,900 mark and... The post Bitcoin (BTC) Price Analysis: Reversal Pattern Confirmation, More Upside? appeared first on Ethereum World News. дальше »
2019-2-19 06:39 | |
|
|
Ethereum Price Weekly Analysis: ETH Primed To Rise Further Above $125
ETH price started a major consolidation after a nasty upward move above $120 against the US Dollar. There is a contracting triangle in place with resistance at $124 on the 4-hours chart of ETH/USD (data feed via Kraken). дальше »
2019-2-17 07:28 | |
|
|
Bitcoin Price Analysis: After Sudden Upswing, Bitcoin Price Drifts Downward
Last week, we saw a violent move to the upside as bitcoin rallied 11% over the course of one day. Since peaking in the upper $3,600s, bitcoin has seen close to zero bullish follow-through, and the price has begun to drift downward over the course of the last week:Figure 1: BTC-USD, Hourly Candles, Downward DriftDownward-drifting markets like this can often be a sign that distribution is taking place. дальше »
2019-2-15 00:21 | |
|
|
Dogecoin Price: DOGE Breaks Above Downward Trend but Meets Resistance
Doge has finally broken above a long-term downtrend which it has been trading in since mid-December. However, the price is struggling to break above a former support level at $0. 002. Price briefly traded above $0. дальше »
2019-2-13 19:44 | |
|
|
Monero Price Analysis: XMR Breaks Back Above $50 — Will the Bullish Momentum Continue?
Support for XMR moving forward: $49.59, $46.92, $45.56, $43.85, $43.12, $41.82. Resistance for XMR moving forward: $52.25, $55.56, $58.22,… The post Monero Price Analysis: XMR Breaks Back Above $50 — Will the Bullish Momentum Continue? appeared first on Invest In Blockchain. дальше »
2019-2-13 14:13 | |
|
|
EOS Price Analysis: EOS Breaks Above $3.00, Creating Fresh Highs for 2019 — Can the Bullish Momentum Continue Towards $3.50?
Support for EOS moving forward: $2. 99, $2. 87, $2. 56, $2. 35, $2. 15, $2. 02, $1. 90. Resistance for EOS moving forward: $3. 09, $3. 17,… The post EOS Price Analysis: EOS Breaks Above $3. дальше »
2019-2-13 12:46 | |
|
|

DASH Price Prediction: Price Breaks Out Above Resistance, Next Resistance at the 100-Day MA?
Long-Term Outlook A look at the Dash Weekly chart in logarithmic form shows that price briefly traded inside the support area at $45-$55, before starting an upward move and is now trading at $80. дальше »
2019-2-11 16:24 | |
|
|
Bitcoin Price Watch: BTC At Risk of More Losses Until It Breaks $3,600
Bitcoin price failed near key resistances at $3,600 and $3,620 against the US Dollar. This week’s followed key bearish trend line is in place with resistance near $3,570 on the hourly chart of the BTC/USD pair (data feed from Kraken). дальше »
2019-1-24 09:45 | |
|
|
Bitcoin Price Analysis: Bitcoin Tests Boundary Support as Demand Weakens
Following last Friday’s drop, bitcoin has found itself coiled, once again, at the bottom of the range it established back in December. With the current market unable to close a new high, the market finds itself in a precarious position:Figure 1: BTC-USD, Daily Candles, Range Support TestThe blue support level shown above illustrates the boundary of the multi-week range bitcoin has been bound by. дальше »
2019-1-18 02:02 | |
|
|
Ethereum Price Analysis: ETH Breaks Key Resistance As Sellers Lose Control
ETH price rallied recently and recovered sharply above $121 and $126 against the US Dollar. Yesterday’s highlighted important bearish trend line was breached at $121 on the hourly chart of ETH/USD (data feed via Kraken). дальше »
2019-1-15 07:08 | |
|
|
Bitcoin Price Watch: BTC Breaks $4K, More Gains Possible
Bitcoin price finally broke the $4,000 barrier and traded towards $4,100 against the US Dollar. There was a break above a major bearish trend line with resistance at $3,830 on the hourly chart of the BTC/USD pair (data feed from Kraken). дальше »
2019-1-7 10:00 | |
|
|
Bitcoin Breaks Above $4,000 Amidst Widespread Crypto Surge
The cryptocurrency markets have been able to maintain their upwards momentum and Bitcoin has now broken above its resistance level that was previously set around $3,900. Bitcoin’s upwards move has sent the overall markets surging. дальше »
2019-1-7 02:00 | |
|
|
Bitcoin Price Analysis: Range-Bound Market Coiled for Next Move
For the better part of a month and a half, bitcoin has been fairly range-bound and unable to establish new lows or new highs. There are some bullish and bearish setups on the horizon for bitcoin, so let’s check out both sides of the argument because currently the market is sitting in the middle of Indecisionville — the most immediate sign of which is this glaringly obvious head-and-shoulders bottom reversal pattern:Figure 1: BTC-USD, Daily Candles, Head-and-Shoulders BottomThis current pattern is nothing more than a setup at the moment, but it represents one potential outcome of this sustained consolidation. дальше »
2019-1-4 02:22 | |
|
|
EOS Daily Price Forecast – December 21
EOS/USD Medium-term Trend: Bullish Resistance levels: $ 6, $7, $8. Support levels: $3, $2, $1. Yesterday, December 20, the price of EOS was in a bullish trend. The crypto's price is above the 12-day EMA and the 26-day EMA but price is breaking the 12-day EMA. If price breaks the EMAs, the crypto is likely […] дальше »
2018-12-21 11:16 | |
|
|
Bitcoin Price Watch: BTC Breaks $4,000, Trend Overwhelmingly Bullish
Key Points Bitcoin price extended gains and broke the $4,000 and $4,050 resistances against the US Dollar. Yesterday’s key bullish trend line is in place with support at $3,850 on the hourly chart of the BTC/USD pair (data feed from Kraken). дальше »
2018-12-21 10:00 | |
|
|
Bitcoin Breaks Above $4,000 Amidst Widespread Market Surge
Following the recent price surge that Bitcoin has experienced after dropping into the low-$3,000 region last week, it has since recovered much of its recent losses and has now climbed above the $4,000 price level. дальше »
2018-12-21 23:00 | |
|
|

Markets Update: BCH Up Over 100% in a Week, BTC Breaks Above $4,000
The cryptocurrency markets appear poised to post the strongest week of trading in months, with BCH up over 115% since Dec. 16. BTC is also on the cusp of posting its strongest weekly candle since February after breaking above $4,000. дальше »
2018-12-20 19:00 | |
|
|
Ripple (XRP) Breaks Resistance, Shows Signs of Overtaking Bitcoin in the long haul
Ripple XRP which seems to have been on the hold since is now breaking out of the resistance against the dollar. Formerly at $0. 2850, it’s now traded above $0. 3 at press time and is likely to continue. дальше »
2018-12-18 21:27 | |
|
|
Bitcoin Price Analysis: BTC/USD Trends of December 17–23, 2018
CoinSpeaker Bitcoin Price Analysis: BTC/USD Trends of December 17–23, 2018 The Bitcoin bullish rally will be anticipated in case there is a strong bullish candle that breaks and closes above the resistance level of $3,726. дальше »
2018-12-17 13:16 | |
|
|
Bitcoin [BTC] Breaks Below Key Support Level Creating New 2018 Low
There had been slightly more bullish conditions in the cryptocurrency market recently. Bitcoin had reached a support level at $3300 and continued to respect this support level for around one week. дальше »
2018-12-14 18:14 | |
|
|

Bitcoin Price Analysis: Yearly Support Breaks as Bitcoin Tests Underlying Demand
After months and months of consolidation, the yearly support finally broke and now bitcoin has found itself in the lower $5000s for the first time since 2017:Figure 1: BTC-USD, Daily Candles, Broken SupportBitcoin managed to drop a staggering 16% yesterday as the market sliced through the long held support like a knife through butter. дальше »
2018-11-16 01:28 | |
|
|
Litecoin Price Analysis: ADA Recover from 7 cents as TRX Bulls Aim At 4 cents
Unless otherwise, we expect traders to buy on dips in lower time frames all thanks to yesterday’s attempts of higher highs. Supporting this view are breaks above key resistance lines in Cardano while Tron might print above Sep 2018 highs today. дальше »
2018-10-16 05:00 | |
|
|
Bitcoin (BTC): A Method To The Madness
Bitcoin (BTC) does not just go up and down, breaks supports and resistances based on sudden whims. Most traders are so focused on the 15 min chart that they miss the big picture. They fail to realize that major trading on exchanges is done by algorithmic bots. дальше »
2018-10-15 21:30 | |
|
|
Ethereum Classic (ETC) Can Easily End The Year Above $100
Ethereum Classic (ETC) is highly likely to trade north of $100 by end of the year. This does not require a very bullish Bitcoin (BTC). In fact, if Bitcoin (BTC) trades around $10,000, that would do the job for Ethereum Classic (ETC). дальше »
2018-10-12 17:30 | |
|
|
Ethereum (ETH) Remains In The Safe Zone, No Cause For Concern Yet
Chart for ETH/USD (4H) Ethereum (ETH) investors have nothing to worry about. The recent decline in Ethereum (ETH) sure was frightful. It is alarming to see the price of an asset decline by more than 10% in a single day. дальше »
2018-10-11 18:30 | |
|
|
Eos (EOS) Investors Unmoved By Bitcoin (BTC) Selloff
Chart for EOS/USD (1W) Cryptocurrency markets plunge deep in the red, dancing to the tune of Bitcoin (BTC). Eos (EOS) investors are not moved by this confusion. In fact, as the above weekly chart for EOS/USD shows, the price of Eos (EOS) has not corrected the same way as the rest of the market. дальше »
2018-10-11 00:30 | |
|
|
Cardano (ADA) Could Moonshot After Coinbase Listing
Chart for ADA/USD (1W) Cardano (ADA) is the cryptocurrency with the highest probability of being listed next on Coinbase. Cardano (ADA), which is supported by IOHK, is the firm run by Charles Hoskinson, the founder of Cardano (ADA). дальше »
2018-10-10 18:30 | |
|
|
Ethereum (ETH)’s Final Showdown: Where To From Here?
Ethereum (ETH) is in a do or die situation. The above chart for ETH/USD shows that Ethereum (ETH) must break to the upside on the 4H timeframe for bullish momentum to hold. If the price breaks below the symmetrical triangle, there is a high probability that it will test the support again. дальше »
2018-10-8 20:00 | |
|
|
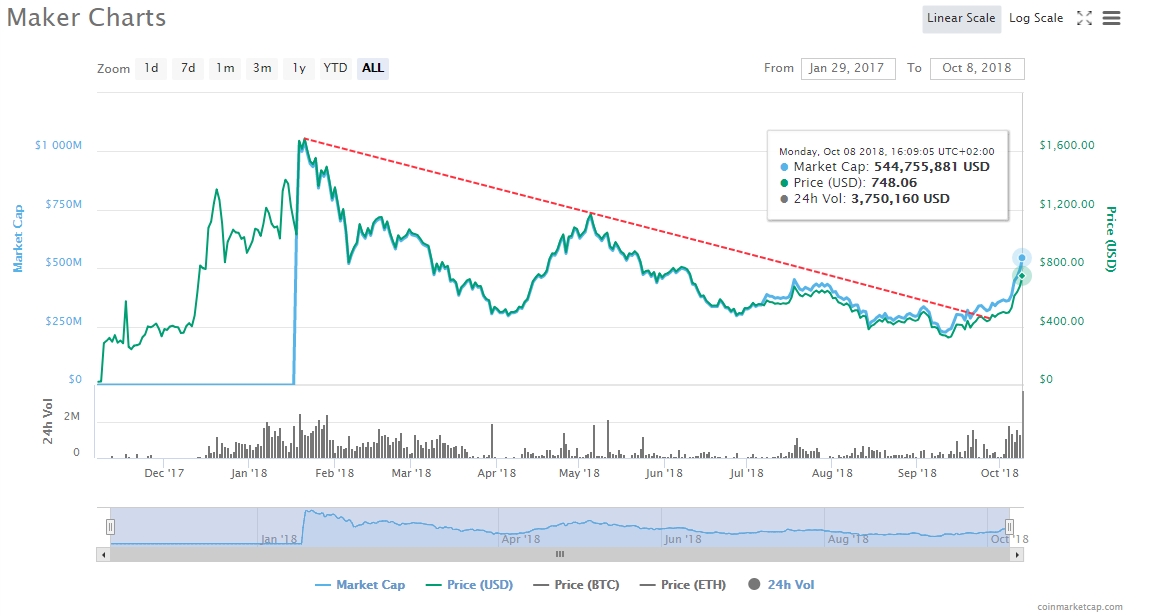
Maker (MKR) Coin Story and its Developments: Breaks Declining Trend Since Record January
A very welcomed start of the week has commenced for the crypto-market industry. Green gaining percentages have taken over with buyers stepping-in after the weekend sell-off and value drops. One that is standing clearly above waters the 22nd largest coin by market capitalization called Maker [MKR]. дальше »
2018-10-8 18:59 | |
|
|
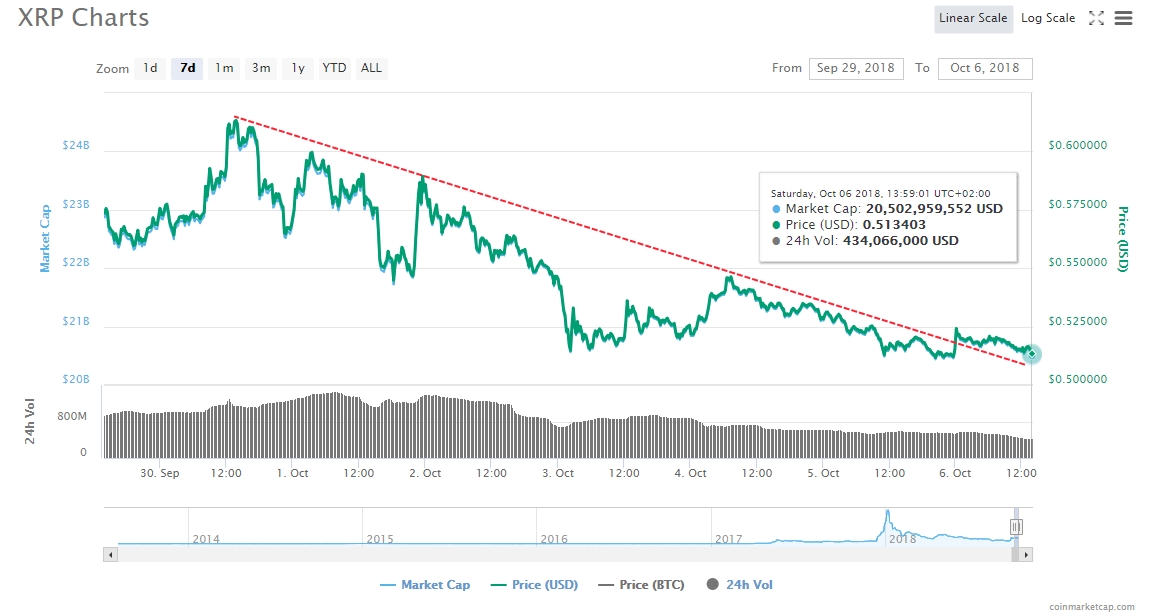
Ripple’s XRP Rise! Also Attempt to Stay Above $0.5000 as it Breaks Weekly Declining Trend
XRP Headline Stealer For the last few months, the third largest coin by market capitalization XRP and its team/firm backing it up Ripple[labs] have been taking center stage with no mercy for the other cryptocurrencies. дальше »
2018-10-7 15:48 | |
|
|
Ripple (XRP) Might Surprise The World In 2019
Chart for XRP/USD (1H) Ripple (XRP) is moving at a very fast pace. Anything is possible at this point. The Ripple team runs a very tight ship and they know how to get things done. The above chart for XRP/USD shows that Ripple (XRP) bulls have a tight grip on the price. дальше »
2018-10-5 17:30 | |
|
|
Ether Price Analysis: Higher Lows Could Yield Retest of Local High
After two back-to-back weeks of record-setting volume, ether finds itself situated below historic resistance and currently unable to reach its downtrend line:Figure 1: ETH-USD, Weekly Candles, Downtrend and Record-Setting VolumeFor months, ether has been unable to break its downward trend. дальше »
2018-10-4 23:55 | |
|
|
Ethereum Classic (ETC)’s Next Move Will Be Decisive
Ethereum Classic (ETC) like many other altcoins has completed its correction. It is down to Bitcoin (BTC) now to resume its uptrend so the rest of the market can follow. The above weekly chart for ETC/BTC shows that Ethereum Classic (ETC) has finally formed a bottom against Bitcoin (BTC). дальше »
2018-10-3 18:00 | |
|
|

Verge (XVG) Breaks the Monthly Declining Trend above $0.017: Latest to Read
As the cryptocurrency market had a very good run the last few days, with the weekend being the end-cake, various coins were able to move above important levels that were tanked by sellers. One that is standing out this Monday morning with a promising value development is the pair XVG/USD – Verge. дальше »
2018-10-1 11:18 | |
|
|
Ripple (XRP) Technical Analysis #005 – Ripple Breaks Above the $0.30 Handle With a 17% Rally
Ripple has seen a 17. 91% price increase, at the time of writing, over the past 24 hours of trading. The cryptocurrency is now exchanging hands at a price of $0. 3241 as the cryptocurrency skyrockets above the $0. дальше »
2018-9-19 20:35 | |
|
|
Ripple (XRP) Breaks Below 5 EMA Again, Price Likely To Fall Further
Ripple (XRP) is not at a good point, for now. The price has once again broken below the 5 EMA and is now likely to fall further. The 4H chart above for XRP/XBT shows that during the past few months, every time the price of Ripple (XRP) has fallen below the 5 EMA, it was followed by a 26% correction. дальше »
2018-8-31 21:30 | |
|
|
Ripple (XRP) Breaks Below 50 EMA, Finds Support At 38.2% Fibonacci
Ripple (XRP) just broke below 50 EMA on the4H timeframe as shown by the 4H chart for XRP/USD above. Normally, this would be the sign of another wave of correction but fortunately for Ripple (XRP), the price has found support at the strong 38. дальше »
2018-8-30 18:00 | |
|
|
Bitcoin Breaks $7,000 as Risk Appetite Takes Over Markets
Bitcoin has finally broken above the $7,000 level following two upward moves on Tuesday. It first attempted to challenge resistance by climbing the $6,750 zone to the $6,900-6,950 area, and then a decisive breakout was capped near $7,100. дальше »
2018-8-28 22:40 | |
|
|

Bitcoin Price Breaks $7000 Resistance To Hit Surprise Multi-Week High
Bitcoin price briefly broke above $7000 August 28, hitting a new high of $7051 on major exchanges – its highest since August 7. ETF Fever Decouples From Bitcoin Price Data from Bitcointicker and other sources confirm the multi-week highs for Bitcoin , which curiously come on the back of multiple rejections of exchange-traded fund applications by US regulators last week. дальше »
2018-8-28 16:00 | |
|
|

EOS Announces Solution to Counter-Reply any RAM-Steal Attacker: EOS/USD Breaks $5.00
The fifth largest coin by market capitalization is welcoming much gain after the roller-coaster pathway that the cryptocurrencies experienced the last days. Only behind MIOTA’s strong 15. 00% increase in the last 24-hours, EOS has jumped upwards for 4. дальше »
2018-8-27 13:05 | |
|
|
Bitcoin Price Watch: BTC/USD Breaks Key Resistance, Dips Remain Supported
Key Points Bitcoin price gained bullish momentum and surged above the $6,480 and $6,550 resistances against the US Dollar. Yesterday’s highlighted key bearish trend line was breached with resistance near $6,475 on the hourly chart of the BTC/USD pair (data feed from Kraken). дальше »
2018-8-22 12:00 | |
|
|

Ether Price Analysis: Historic Support Breaks, Leads to Signs of Capitulation
In two short weeks, ETHUSD has devalued by 50% of its market value. With little to no relief for the underwater bulls, ether seems to be accelerating downward as buyer confidence is lacking and showing signs of capitulation. дальше »
2018-8-15 01:10 | |
|
|
Bitcoin Cash Price Analysis: BCH/USD Upsides Capped Near $620
Key Points Bitcoin cash price attempted a recovery above the $600 level against the US Dollar. There is a short-term ascending channel formed with support at $590 on the hourly chart of the BCH/USD pair (data feed from Kraken). дальше »
2018-8-10 07:08 | |
|
|
Ripple Price Analysis: XRP/USD Could Explode Soon?
Key Highlights Ripple price is trading in a range above the $0. 4300 support area against the US dollar. There is a short-term contracting triangle formed with resistance near $0. 4560 on the hourly chart of the XRP/USD pair (data source from Kraken). дальше »
2018-7-30 09:30 | |
|
|