Новости о Bitcoin Price [ Фото новости ] [ Свежие новости ] | |
Bitcoin: As "weak hands" begin to capitulate, what should you expect
Bitcoin's price might fall below its Short-Term Holders Realized Price. This usually indicates a price bottom and is often followed by a breakout in either direction. As Bitcoin [BTC] continThe post Bitcoin: As "weak hands" begin to capitulate, what should you expect appeared first on AMBCrypto. дальше »
2023-8-14 16:30 | |
|
|
Here's what's keeping Bitcoin below the $30,000-mark
Bitcoin's price stabilized around $29,000-$30,000 amidst market volatility Seller-taker volume and declining miner revenue surfaced as potential reasons for price suppression Amidst the backThe post Here's what's keeping Bitcoin below the $30,000-mark appeared first on AMBCrypto. дальше »
2023-8-13 17:30 | |
|
|
Black Swan Author Warns Of Bitcoin Volume Slump As BTC Fails To Breach $30,000
Bitcoin seems on the verge of seeing downside volatility during today’s trading session if bears can break current support. However, price action has been slow as all major narratives, including those from macroeconomic forces, have lost strength. дальше »
2023-8-12 00:00 | |
|
|
Bitcoin Price Loses Key Support Level: Here’s What BTC Needs to Do to Shake-Off Bears
Bitcoin, the world’s premier cryptocurrency, has recently shown signs of vulnerability. Over the past month, the price has struggled to maintain its strong support level at $29,250. This has led to a flux in its value, with a decrease of approximately 4% in the last 30 days. дальше »
2023-8-7 13:46 | |
|
|
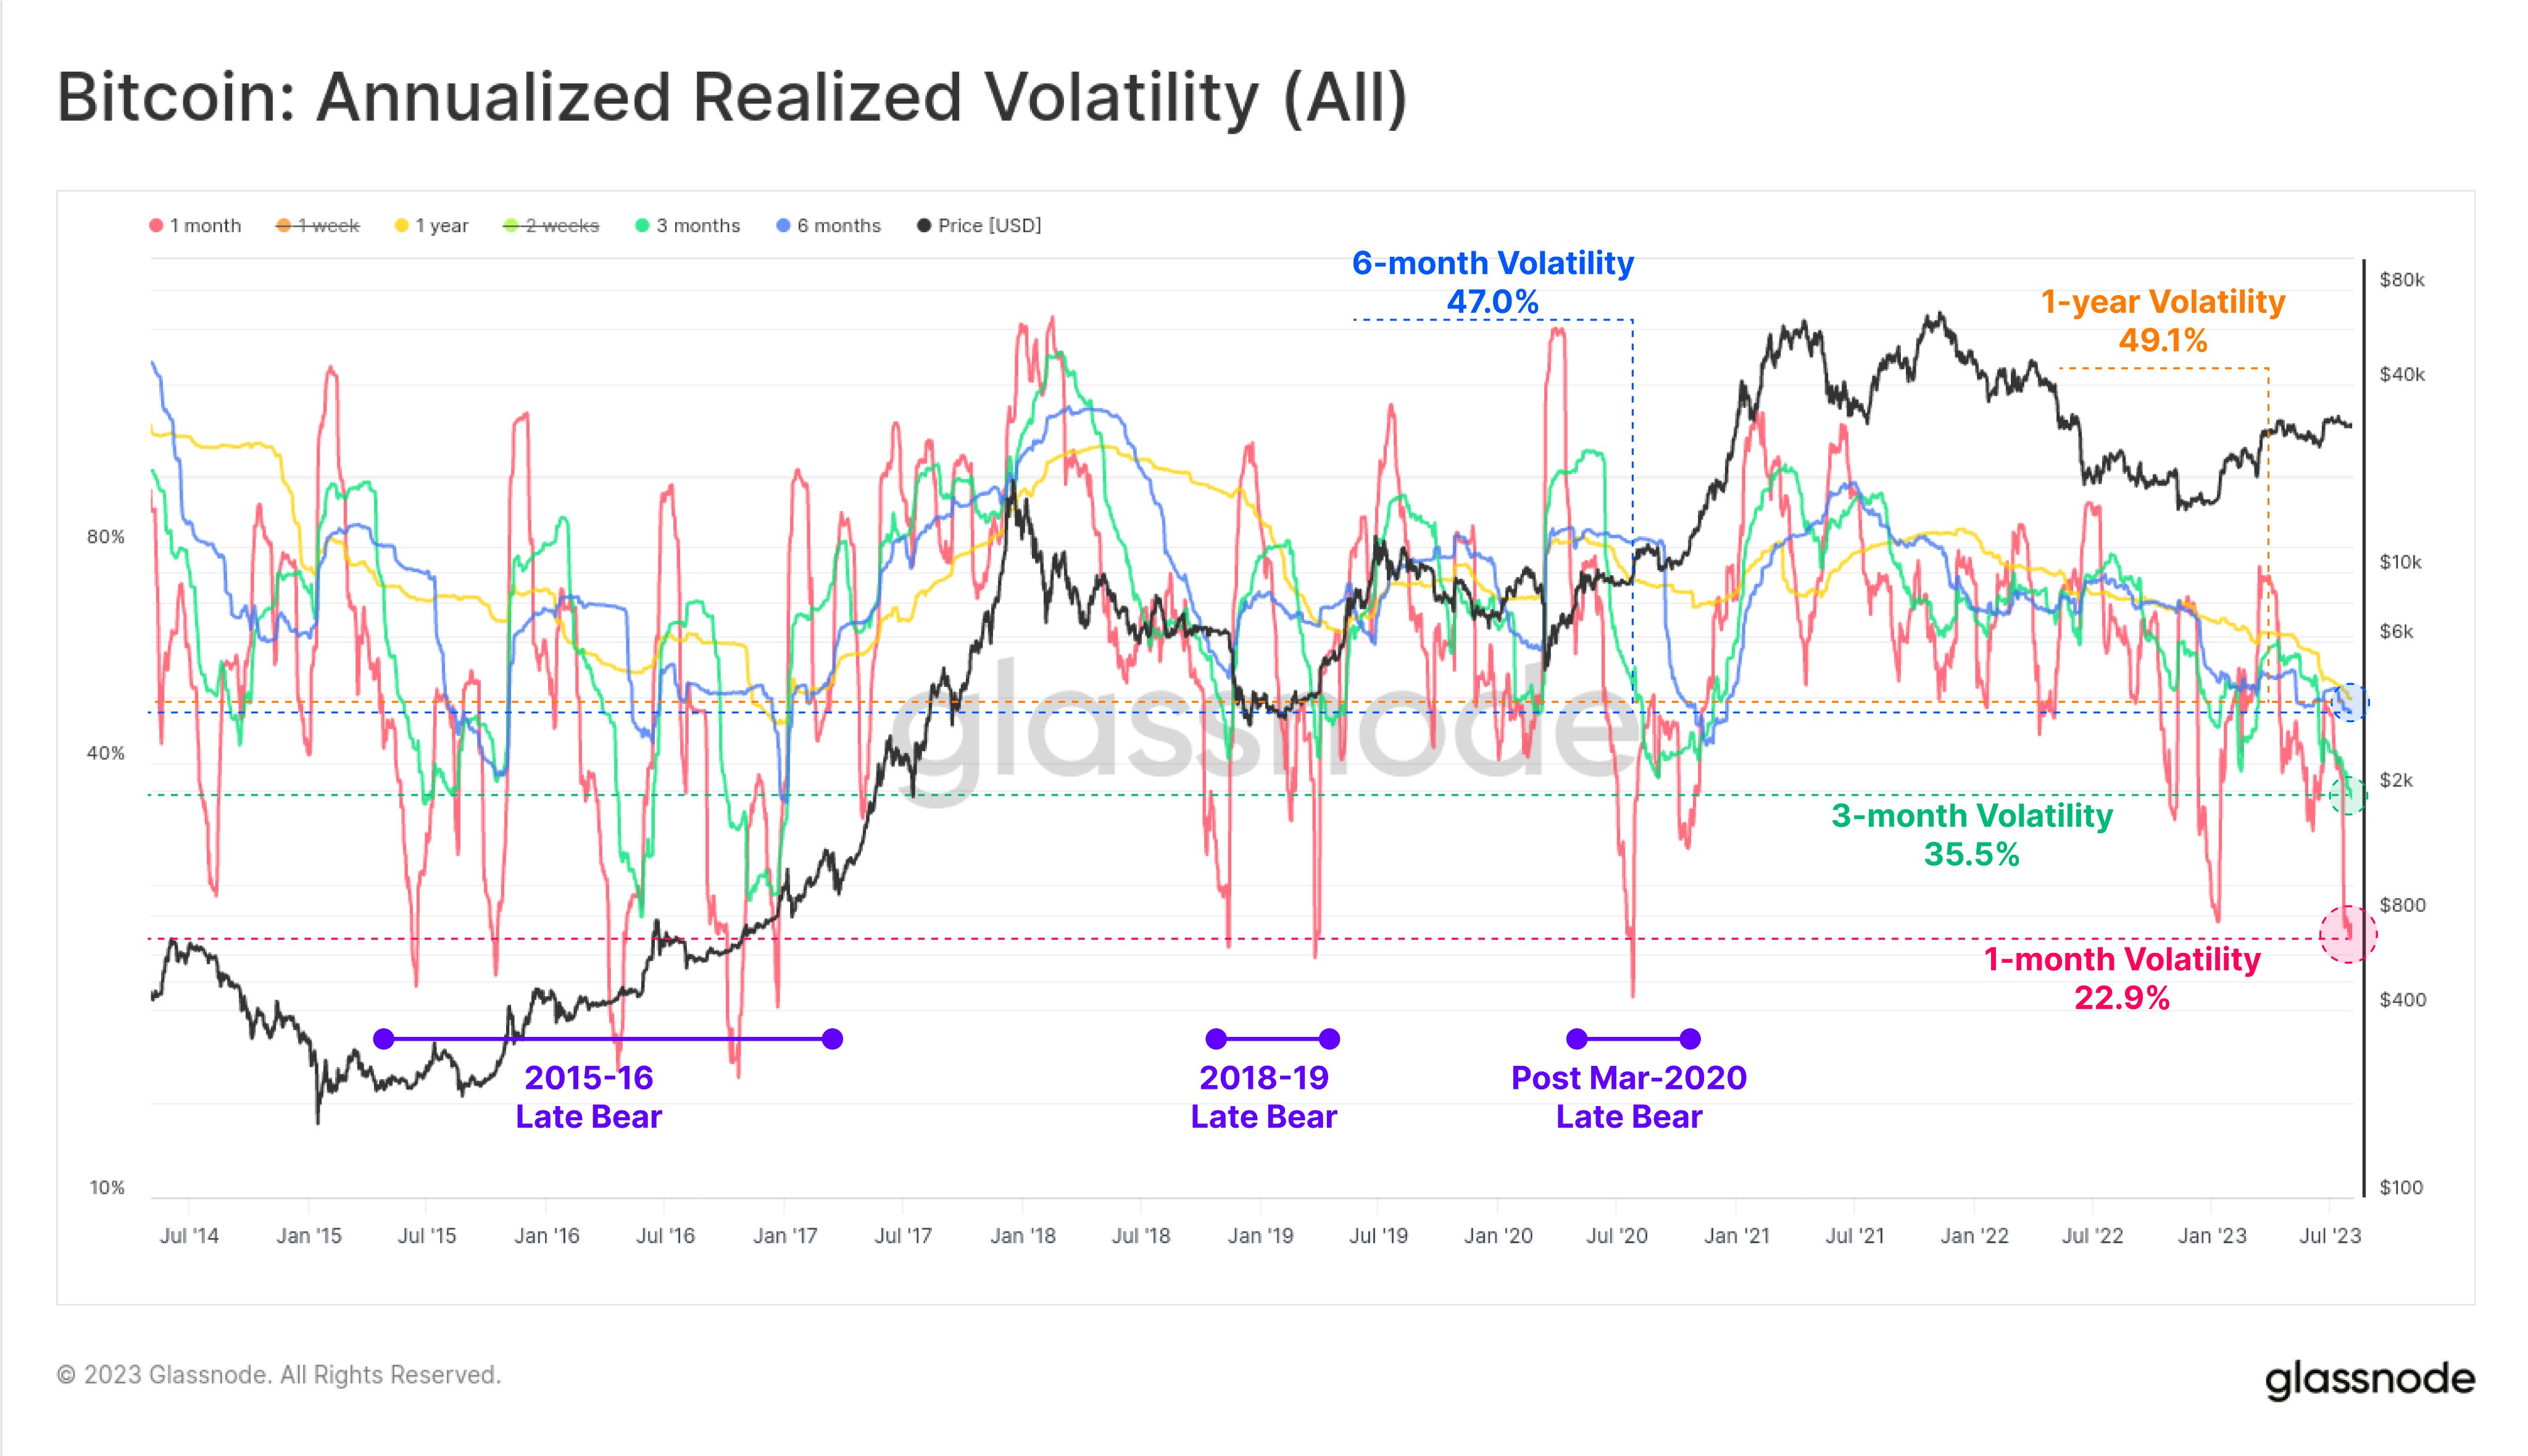
Behind The Quiet: Low Bitcoin Volatility Masks Underlying Market Dynamics
In the world of Bitcoin, silence is not always golden. The recent weeks have seen Bitcoin’s price volatility drop to historical lows, with the BTC price trading mostly between $29,000 and $30,000. дальше »
2023-8-7 13:00 | |
|
|
Everything Divided By 7 Million: Popular Bitcoin Price Heuristics Are Missing The Mark
Some of the most popular bitcoin price prediction tools are underestimating the impact of migrating capital. дальше »
2023-8-6 15:00 | |
|
|
Bitcoin Price Stuck In Range, But Here’s Why Bulls Are Safe
Bitcoin price is moving lower below $29,500. BTC could start a fresh increase if there is a close above the $30,000 resistance zone. Bitcoin is slowly moving lower below the $29,500 pivot level. The price is trading below $29,300 and the 100 hourly Simple moving average. дальше »
2023-8-3 08:09 | |
|
|
Bitcoin Cash (BCH) price forms a falling wedge: Is it safe to buy?
Bitcoin Cash price has formed a falling wedge pattern on the 4H chart. Focus shifts to the upcoming interest rate decision by the Fed. Bitcoin Cash price has retreated in the past few weeks as the recent momentum in the crypto industry waned. дальше »
2023-7-27 18:31 | |
|
|
Bitcoin Price Could Recover But Upsides Might Be Attractive To Bears
Bitcoin price is attempting a recovery wave above the $29,200 level. BTC must clear the $29,600 resistance to start a decent recovery wave. Bitcoin is consolidating above the $29,000 support zone. дальше »
2023-7-26 07:09 | |
|
|
Bitcoin Cash Price Could Restart Rally To $300 If It Breaks This Resistance
Bitcoin Cash price started a downside correction and tested $230 against the US Dollar. BCH might aim a fresh rally toward the $280 and $300 levels. Bitcoin cash price is consolidating above the $230 level against the US Dollar. дальше »
2023-7-24 08:44 | |
|
|
Bitcoin Price Plunges After Rejection, Here’s Why Bears Aim Fresh Lows
Bitcoin price is moving lower from the $30,350 level. BTC is showing bearish signs and might decline further toward the $29,650 and $29,500 support levels. Bitcoin is moving lower below the $30,000 pivot level. дальше »
2023-7-24 06:22 | |
|
|
What Is Bitcoin Rainbow Chart & How to Predict BTC Price?
The Bitcoin Rainbow Chart is a logarithmic BTC price chart that uses color bands to show the range of possible prices for Bitcoin at any given time. Since it draws data from more than a decade-long history of Bitcoin price movement, it can be an especially useful tool for traders and investors who seek assistance […] The post What Is Bitcoin Rainbow Chart & How to Predict BTC Price? appeared first on CaptainAltcoin. дальше »
2023-7-17 00:16 | |
|
|
Pro delivers a $2 trillion BCH, Solana, Litecoin, Mina, Bitcoin price prediction
An analyst at Standard Chartered delivered a strong Bitcoin prediction. He expects BTC price to jump to $120,000 in 2024. Bitcoin price has continued wavering in the past few weeks as investors wait for the next important crypto news and US inflation data. дальше »
2023-7-11 15:43 | |
|
|
Bitcoin Sharks And Whales Go On $2.15 Billion Buying Spree, Is It Time To Sell?
Bitcoin has seen both highs and lows over the past month as various developments in the space put the digital asset’s price into a pull-and-push trend. However, investors have remained undeterred by the cryptocurrency’s movements and have rather chosen to continue to accumulate. дальше »
2023-7-10 21:00 | |
|
|
Bitcoin (BTC) Price Teeters on $30,000 Edge – Will It Sink or Swim?
The Bitcoin (BTC) price faces the possibility of further downside unless it quickly clears the $31,500 level. The post Bitcoin (BTC) Price Teeters on $30,000 Edge – Will It Sink or Swim? appeared first on BeInCrypto. дальше »
2023-7-10 15:15 | |
|
|
Bitcoin Price Rejects $31K and Turns At Risk of Drop To $30K
Bitcoin price failed to settle above $31,000 and corrected lower. BTC could continue to move down toward the $30,000 support zone. Bitcoin is correcting gains from the $31,000 and $31,250 resistance levels. дальше »
2023-7-6 06:12 | |
|
|
Dawn For Bitcoin: $5 Billion In Options Expire And Could Push Price Towards $31,000
Still recording some green on small timeframes, the price of Bitcoin has remained above $30,400. Despite the recent selling pressure across the sector, the support around this level held, providing bulls a chance to fight back. дальше »
2023-6-30 01:11 | |
|
|
Bitcoin’s exchange balance drops to 5-year low as price hits $30K
Since June 22, Bitcoin has been trading above the critical psychological level of $30,000. This price rally is a result of increased demand for the digital asset, a demand that is further exacerbated by the low availability of Bitcoin on exchanges. дальше »
2023-6-28 19:00 | |
|
|
Bitcoin's $30k fortification developing cracks?
Bitcoin recently saw a spike in its mean inflow as netflow turned positive. BTC price was on a consecutive decline, indicating possible price correction. Bitcoin [BTC] has been basking in itThe post Bitcoin's $30k fortification developing cracks? appeared first on AMBCrypto. дальше »
2023-6-27 02:30 | |
|
|
Here’s why the Bitcoin Cash (BCH) price has just gone parabolic
Bitcoin Cash price has been in a strong bullish trend in the past few days. The coin has surged by over 150% from the lowest level in May. This rally is being supported by the Bitcoin ETF applications. дальше »
2023-6-26 19:00 | |
|
|
Bitcoin's activity stagnates despite price uptrend: Here's why
Bitcoin's transition phase was at 227 days at press time, as the market was awaiting a bull run. Supply on exchanges dropped as HODLers continued HODLing. Bitcoin's [BTC] price has finally bThe post Bitcoin's activity stagnates despite price uptrend: Here's why appeared first on AMBCrypto. дальше »
2023-6-26 08:30 | |
|
|
Russia Crisis Hits Headlines: Bitcoin Price Holds Ground Near $31k Mark
Bitcoin price grew by 0.34% in the last 24 hours to $30,727 despite the recent happenings in Russia and fears of a coup. The post Russia Crisis Hits Headlines: Bitcoin Price Holds Ground Near $31k Mark appeared first on BeInCrypto. дальше »
2023-6-26 14:00 | |
|
|
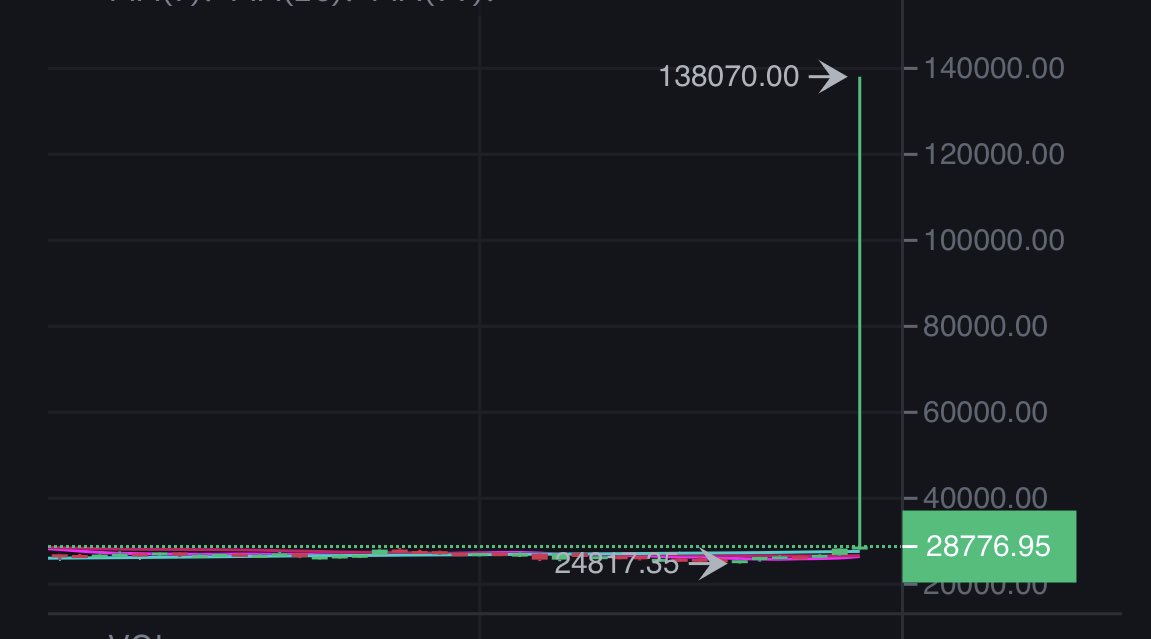
Bitcoin Hits $138,000 On Binance US, What Happened?
The Bitcoin price has been experiencing a sharp rally since last Thursday, when BlackRock filed its application for a Bitcoin spot ETF. Since hitting its local low of $24,819 right along the Tether FUD, the BTC price has risen by over 16% since the BlackRock news broke. дальше »
2023-6-21 10:45 | |
|
|
How A 90-Year Old TA Theory Predicted The Sudden Bitcoin Boom
Bitcoin price is suddenly on the upswing, supported by a surge of positive news. If the recent filing of a Bitcoin ETF by BlackRock and the debut of EDX — a new non-custodial crypto exchange backed by Charles Schwab, Citadel, Fidelity, and others — seem all too coincidentally timed with the bullish price action, then […] дальше »
2023-6-21 04:57 | |
|
|
Bitcoin liveliness indicates hodler behavior during extended price stability
Despite its recent resurgence to regain the 200-week moving average (WMA), Bitcoin’s price has remained within a tight trading range for the past week. BlackRock’s announcement of integrating Bitcoin into their ETF portfolios and Bitwise’s refiling for a Bitcoin spot ETF are significant news that could potentially move Bitcoin’s price. дальше »
2023-6-20 19:00 | |
|
|
First Mover Asia: Why Did Bitcoin's Price Hold Above $27K Over the Weekend? Two Analysts Expect Continued Resilience
ALSO: The bitcoin options put/call ratio across exchanges has sunk to 0.47, suggesting that fewer investors are seeking downside protection against price declines than they had prior to the passage of a bill to raise the U.S. debt ceiling. дальше »
2023-6-5 04:01 | |
|
|
Bitcoin above $28K - Why that's more than a possibility
Bitcoin’s price increased by more than 2% in the last seven days Open interest also rose, increasing the chances of a continued uptrend Bitcoin’s [BTC] price, after crossing $28,000, oThe post Bitcoin above $28K - Why that's more than a possibility appeared first on AMBCrypto. дальше »
2023-5-31 05:30 | |
|
|
Bitcoin (BTC) Price Hits $28,000 Barrier: Significance and Potential Impact
The Bitcoin (BTC) price is likely to resume its descent towards the support line of its pattern The post Bitcoin (BTC) Price Hits $28,000 Barrier: Significance and Potential Impact appeared first on BeInCrypto. дальше »
2023-5-29 18:00 | |
|
|
JPMorgan Predicts Bitcoin (BTC) To Revisit $45,000, Here’s Why
In a recent note, JPMorgan strategists have made a prediction, suggesting that Bitcoin (BTC) could soar and revisit its former trading price of $45,000 due to the rising price of gold. This prediction comes amid Bitcoin’s price action of a blend of bulls and bears in the past week. дальше »
2023-5-26 19:20 | |
|
|
The Bitcoin Rollercoaster: Why Every Upward Move Is Followed By A Steep Drop?
Bitcoin (BTC) has failed to hold onto gains over the past few weeks, giving back nearly all price increases shortly after they are made. According to crypto analyst and trader Daan Foppen, this phenomenon can be attributed to the outsized influence of futures markets on Bitcoin’s price action. дальше »
2023-5-25 00:20 | |
|
|
Bitcoin Cash (BCH) Price Fails to Break Out – Is $100 Next?
Bitcoin Cash failed to take off after recent network upgrade. On-chain data reveals critical factors behind the bearish BCH price prediction The post Bitcoin Cash (BCH) Price Fails to Break Out – Is $100 Next? appeared first on BeInCrypto. дальше »
2023-5-24 17:00 | |
|
|


