Новости о Above Weekly [ Фото новости ] [ Свежие новости ] | |

Bitcoin (BTC) Price Weekly Analysis: Trend Overwhelmingly Bullish To $4,200
Bitcoin price slowly moved higher and dips remained supported above $3,800 against the US Dollar. The price fell significantly recently, but buyers protected the $3,800 support area. There is a crucial ascending channel is in place with support at $3,830 on the 4-hours chart of the BTC/USD pair (data feed from Kraken). дальше »
2019-3-10 08:00 | |
|
|
Ethereum Price Weekly Analysis: ETH Preparing For Larger Breakout
ETH price continues to face a strong resistance just below the $140 level against the US Dollar. The price dipped sharply recently, but it recovered above the $134 support level. There is a key bullish trend line forming with support at $132 on the 4-hours chart of ETH/USD (data feed via Kraken). дальше »
2019-3-10 07:08 | |
|
|
Stellar [XLM] Price Prediction: The Price Is Heading Toward the February 24 High
Long-Term Outlook A look at the Weekly logarithmic chart for XLM shows that the price is currently trading at $0. 091, slightly above the main support area near $0. 07. After three weekly candles representing with long wicks, representing indecision, the price finally made a bullish weekly candle. дальше »
2019-3-10 19:29 | |
|
|
Bitcoin Price Analysis Update: BTC Held Up by Weekly MA, But Still Following the “Parabolic Trend”
The leading cryptocurrency is back at above $3,900 looking to break the $4k mark. On March 4th, Bitcoin price went from $3,680 to $3,870 level seeing a surge of 5 percent. Since then, Bitcoin has been seeing a slight upward shift in the price as it slowly moved to the $3,890 mark. The leading cryptocurrency […] дальше »
2019-3-8 19:46 | |
|
|
Binance Coin Price Prediction: BNB Has Been on a Massive Tear, Will It Ever Reach a Top?
Long-Term Outlook: A look at the Weekly chart for BNB shows that the price has broken through the resistance near $8 and is currently on the process of forming another bearish engulfing candle. This is the fifth weekly bullish candle in a row. дальше »
2019-3-9 18:09 | |
|
|
XRP Price Prediction: Will We Finally Break Out of the Symmetrical Triangle?
Long-Term Outlook A look at the Weekly chart for XRP shows that the price is trading at $0. 32, slightly above the support line near $0. 3. The next support area can be found near $0. 15, while the closest resistance area is found near $0. дальше »
2019-3-7 15:50 | |
|
|
Bitcoin Price Watch: BTC Comeback Is On The Cards
Bitcoin price broke the key $3,860 resistance and traded to a new weekly high against the US Dollar. The price is losing bullish momentum, but it is likely to continue above $3,900 and $3,940. There is a key bullish trend line formed with support at $3,850 on the hourly chart of the BTC/USD pair (data. дальше »
2019-3-7 09:30 | |
|
|
Tron [TRX] Price Prediction: The End of the Symmetrical Triangle Is Near, When Will the Breakout Occur?
Long-Term Outlook A look at the Weekly chart for XLM shows that the price is currently trading at $0. 024, between the 21 and 50-period moving averages. It has found support above the 21-period MA. дальше »
2019-3-6 13:19 | |
|
|
Ethereum [ETH] Price Prediction: Will We Break Out Above the Recent $170 High?
Long-Term Outlook A look at the Weekly chart in logarithmic form for Ethereum shows that the price hit the major resistance area near $170, coinciding with the 21-period moving average and got pushed back It created a bearish inverted hammer, followed by two small bearish candles. дальше »
2019-3-5 13:29 | |
|
|
Litecoin Price Prediction: LTC Is Creating a Head and Shoulders Pattern, Will the Neckline Provide Support?
Long-Term Outlook A look at the Weekly chart for LTC/USD shows that price made a temporary bottom at $28, inside the support area formed by the highs of 2014. It is currently trading at $48, slightly above the 21-period moving average but below the 50-period MA and the Ichimoku cloud. дальше »
2019-3-4 11:59 | |
|
|
Ripple Price Analysis: XRP Targets Fresh Weekly Lows Before Upside
Ripple price failed to gain momentum above the $0. 3150 resistance and declined against the US dollar. The price is now trading well below the $0. 3140 resistance and the 100 hourly simple moving average. дальше »
2019-3-4 08:00 | |
|
|
Dogecoin Price Analysis: DOGE Is Trading Inside a Symmetrical Triangle, When Will the Breakout Occur?
Long-Term Outlook A look at the Weekly chart for Dogecoin shows that price is trading inside the major support area near $0. 0019 formed by previous lows and has found support right above the 200-period MA. дальше »
2019-3-4 19:59 | |
|
|
XRP Price Prediction: XRP Is Trading Inside a Symmetrical Triangle, When Will the Breakdown/Out Occur?
Long-Term Outlook A look at the Weekly chart for XRP shows that price is trading at $0. 32, slightly above the major support area near $0. 27. The previous week’s candle had a large upper wick, indicating that sellers have the upper hand. дальше »
2019-3-3 21:19 | |
|
|
Stellar Price Prediction: XLM Has Bounced on the Support Line, Where Is It Heading Now?
Long-Term Outlook A look at the Weekly chart for XLM in logarithmic form shows that price is trading above the major support area is $0. 06-$0. 07, currently trading at $0. 086. Furthermore, the price is facing very close resistance from the 200-period moving average and trading below the 21 and 50 MAs and the Ichimoku Cloud. дальше »
2019-3-1 14:59 | |
|
|
Tron Price Prediction: TRX Is Trading Inside a Descending Triangle, When Will the Breakdown/Out Occurr?
Long-Term Outlook A look at the weekly chart for TRX/USD shows that price is currently trading between the 21 and 50-period moving averages at $0. 0245. It has failed twice to break out above the resistance area near $0. дальше »
2019-2-28 12:39 | |
|
|
Ethereum Price Analysis: ETH Recovery Facing Significant Resistance
ETH price traded lower and broke the recent swing low to form near low near $126 against the US Dollar. The price bounced back sharply above the $130 resistance after trading to a new weekly low. дальше »
2019-2-28 07:08 | |
|
|
Ethereum Price Prediction: ETH Failed to Break Above the 21-week Moving Average, Will the Next Attempt Be Successful?
Long-Term Outlook A look at the Ethereum Weekly logarithmic chart shows that the price made a temporary bottom at $80 inside the minor support area, before starting an upward move. However, once reaching the minor resistance is at $160, it was rejected and formed a hammer candle (yellow arrow), which when found on uptrends usually indicates […] Ethereum Price Prediction: ETH Failed to Break Above the 21-week Moving Average, Will the Next Attempt Be Successful? was originally found on Cryptocurrency News | Blockchain News | Bitcoin News | blokt.com. дальше »
2019-2-27 12:04 | |
|
|
Ethereum Price Analysis: ETH Targets Fresh Weekly Lows Below $130
ETH price failed to move above the $140 and $142 resistance levels against the US Dollar. The price broke the $136 support and it seems like it could continue to move down in the near term. Yesterday’s highlighted key breakout pattern was breached with support at $136 on the hourly chart of ETH/USD (data feed. дальше »
2019-2-27 07:08 | |
|
|
Litecoin Price Prediction: LTC Got Rejected at $50, Will the Next Attempt Be Successful?
Long-Term Outlook A look at the Weekly chart for Litecoin in logarithmic form shows that price has seemingly found support above the 200-period MA and is trading at $45. Price is trading slightly below the resistance area near $50 and the 50-period MA/Ichimoku cloud. дальше »
2019-2-26 12:59 | |
|
|

Bitcoin Price Analysis: Bullish Rejection Wipes Out Bitcoin’s Weekend Gains
Over the weekend, a strong rally was stifled by an even stronger rejection as the bitcoin market was shoved into a band of overhanging resistance. This band of resistance has been mentioned several times in our analyses over the last few weeks as it has proven impossible to overcome for the time being:Figure 1: BTC-USD, Daily Candles, Failed BreakoutThis run to the low $4,000s coincided with a breakout of a rather large symmetrical triangle consolidation shown above. дальше »
2019-2-26 02:42 | |
|
|
XRP Price Prediction: Price Is Back at the Major Support Area, Where Is It Going Next?
Long-Term Outlook: A look at the Weekly chart for XRP shows that price is trading at $0. 3, slightly above the support area near $0. 28. Last week’s candle was an inverted hammer with a very long upper wick, indicating that the bears are trying to gain control. дальше »
2019-2-25 12:54 | |
|
|

Bitcoin Price Analysis – Bulls Blast Through $4K But is a Correction Imminent?
Bitcoin price continued surging through the early hours of Sunday morning, making new highs for 2019, up 1. 9% at $4190. As we head into the weekly close we look at the price action and what may lie ahead. дальше »
2019-2-24 15:00 | |
|
|

Dogecoin Price Prediction: DOGE Has Broken Out of the Downward Channel, Where Is It Heading Next?
Long-Term Outlook A look at the Weekly chart for Dogecoin shows that price is currently trading at $0. 0021, on the edge of the support area formed by previous lows. Furthermore, we can see that price has found support right above the 200-period MA. дальше »
2019-2-24 13:44 | |
|
|
Bitcoin Price Weekly Analysis: BTC’s Bullish Break Looks Real Towards $4,500
Bitcoin price extended gains and broke the $3,950 and $4,000 resistance levels against the US Dollar. The price traded to a new 2019 high above $4,100 and it could continue to rise in the near term. дальше »
2019-2-24 09:00 | |
|
|
Ethereum Price Weekly Analysis: ETH Sets New 2019 High, Eyes $175
ETH price finally broke the $149 and $150 resistance levels and gained pace against the US Dollar. The price traded above the $160 resistance and formed a new 2019 high above $165. There is a major bullish trend line formed with support near $148 on the 4-hours chart of ETH/USD (data feed via Kraken). дальше »
2019-2-24 08:00 | |
|
|
Stellar Price Prediction: Did XLM Finally Make a Bottom at $0.07 and Are We Going to Move Past $0.1?
Long-Term Outlook A look at the Weekly chart for XLM / USD in logarithmic form shows that price is trading above the support area of $0. 06/$0. 07 created by the highs of April 2018. Price has created a small amount of bullish divergence with the RSI. дальше »
2019-2-23 14:19 | |
|
|
TRON Price Prediction: After Falling to the Support Area Near $0.024, When Will TRX Break Above the Resistance Line?
Long-Term Outlook A look at the Weekly chart for TRX shows that price is currently trading at $0. 025, between the 21 and 50-period moving averages. Price is slightly below the resistance area near $0. дальше »
2019-2-23 12:59 | |
|
|
TRON Price Prediction: After Falling to the Support Area Near $0.24, When Will TRX Break Above the Resistance Line?
Long-Term Outlook A look at the Weekly chart for TRX shows that price is currently trading at $0. 025, between the 21 and 50-period moving averages. Price is slightly below the resistance area near $0. дальше »
2019-2-22 12:59 | |
|
|
XRP Price Prediction: XRP Is Very Close to Breaking Through Resistance, When Will a Successful Attempt Occur?
Long-Term Outlook A look at the Weekly chart for XRP/USD shows that price is currently trading at $0. 33, slightly above the support area near $0. 28. The RSI is at 43, indicating neither overbought nor oversold conditions. дальше »
2019-2-21 12:54 | |
|
|
Ethereum Price Prediction: ETH Breaks Out Above the Daily Ichimoku Cloud, Will It Move Past the 21-week MA?
Long-Term Outlook A look at the Weekly chart for ETH/USD in logarithmic form shows that price has bounced back after finding support in the minor support area near $80. The price is currently slightly below the minor resistance area at $160 and facing very close resistance from the 50-period MA. дальше »
2019-2-20 12:09 | |
|
|
Bitcoin Price Analysis: Consolidation Breaks Out Into Macro Resistance Test
Over the course of the last 10 days, bitcoin has managed to rally nearly 20% in value as it burst through two major resistance levels and is now beginning the test of a major macro level:Figure 1: BTC-USD, Daily Candles, Macro ResistanceWe can see a clear, descending supply-and-demand channel that governed the market for the last two months. дальше »
2019-2-20 01:38 | |
|
|
Litecoin Price Prediction: Is LTC Going to Break Above $50, or Will It Make a Double Top?
Long-Term Outlook A look at the Weekly chart for Litecoin shows that the price of LTC/USD is currently trading within the major resistance area found near $50, formed by previous support. Price is currently trading at $49. дальше »
2019-2-19 16:34 | |
|
|

Bitcoin Price Analysis: BTC Bulls Charge Towards $4,000
Bitcoin price finally broke out of a ten day consolidation above $3,500 this morning, having held the 38. 2% retracement level for the majority of last week. We take a look at what this means going into the week. дальше »
2019-2-18 15:00 | |
|
|

TRON Price Prediction: TRX Has Retraced Back to the Minor Support Area, Will It Start a Move Upward in the Short-term?
Long-Term Outlook A look at the weekly chart for TRX shows that the price is slightly below the major resistance area at $0. 03, currently trading at $0. 024. Price has found support above the 21-period MA and is trading below the 50-period MA, which has offered resistance to price. дальше »
2019-2-17 13:04 | |
|
|
Bitcoin Price Weekly Analysis: BTC Signaling Bullish Continuation, $4K Incoming?
Bitcoin price started a downside correction after a sharp move towards $3,750 against the US Dollar. The price corrected lower and tested the $3,540-3,530 support area, where buyers emerged. Later, there was a break above a key bullish flag with resistance near $3,570 on the 4-hours chart of the BTC/USD pair (data feed from Kraken). дальше »
2019-2-17 09:00 | |
|
|
Ripple Price Weekly Analysis: XRP At Risk of Sharp Bearish Reaction
Ripple price is struggling to clear the $0. 3000 and $0. 3100 resistance levels against the US dollar. There is a crucial bearish trend line formed with resistance at $0. 3000 on the 4-hours chart of the XRP/USD pair (data source from Kraken). дальше »
2019-2-17 08:00 | |
|
|
Ethereum Price Weekly Analysis: ETH Primed To Rise Further Above $125
ETH price started a major consolidation after a nasty upward move above $120 against the US Dollar. There is a contracting triangle in place with resistance at $124 on the 4-hours chart of ETH/USD (data feed via Kraken). дальше »
2019-2-17 07:28 | |
|
|
Bitcoin Vs Litecoin – Bull Flags Yet to Play Out for BTC & LTC
It has been a week of tight trading for bitcoin as it trades between two important levels for price action. Below price lies an important weekly level at $3492. Above price is a level at $3680 which has acted as both support and resistance a number of times since mid-December. дальше »
2019-2-16 18:39 | |
|
|
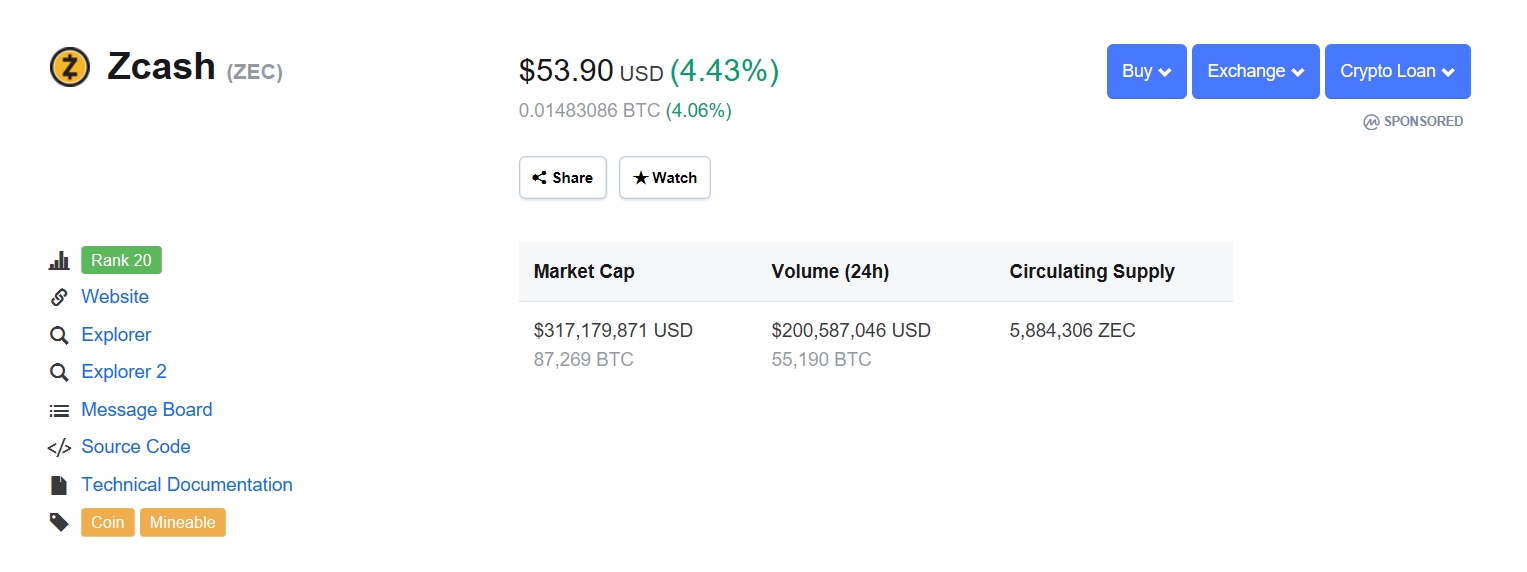
Zcash [ZEC] Price 4.5% Gain: Latest news to Stay Updated
Per time of writing the 20th largest coin by market capitalization Zcash is counting 4. 45% gain for the last 24-hours against the US Dollar. Source: coinmarketcap Breaking above the weekly declining trend acted as a catalyst for traders to step in and take the most out of the opportunity however the $55. дальше »
2019-2-13 14:18 | |
|
|
TRON Price Prediction: TRX / USD Has Broken Down From a Short Term Triangle Pattern, Where Is the Coin Heading Next?
Long-Term Outlook A look at the weekly chart for TRX shows that the price is currently trading at $0. 024 after retracing from the major resistance area near $0. 03. Price is trading above the 21-period MA but below the 50-period MA, which is offering resistance to price. дальше »
2019-2-13 14:14 | |
|
|
XRP Price Prediction: A Triple Bottom or a Cup and Handle Pattern?
Long-Term Outlook A look at the Weekly chart for XRP shows that the price is trading at $0. 3, right above the long-term support area at $0. 26-$0. 29. If the support area fails, the next one will be found near $0. дальше »
2019-2-12 14:48 | |
|
|

Bitcoin Price Analysis: $4000 in Sight After Last Week’s Bullish Move
As Bitcoin price finished the week with a strong move to the upside, we take a look at what this means for the Bulls and Bears heading into the week. Weekly Chart Bitcoin price closed the week at $3,650 (+6. дальше »
2019-2-11 17:00 | |
|
|

DASH Price Prediction: Price Breaks Out Above Resistance, Next Resistance at the 100-Day MA?
Long-Term Outlook A look at the Dash Weekly chart in logarithmic form shows that price briefly traded inside the support area at $45-$55, before starting an upward move and is now trading at $80. дальше »
2019-2-11 16:24 | |
|
|
Stellar Price Prediction: XLM Broke Out of the Descending Wedge, Is a Double Bottom in Store?
Long-Term Outlook A look at the Weekly chart for XLM in logarithmic form shows that price is currently trading at $0. 077, slightly above the main support area formed by the highs of 2017 near $0. дальше »
2019-2-10 18:59 | |
|
|
Ripple Price Weekly Analysis: XRP Primed For More Upsides
Ripple price bounced back sharply and broke the $0. 3000 resistance level against the US dollar. There was a break above a major bearish trend line with resistance near $0. 2900 on the 4-hours chart of the XRP/USD pair (data source from Kraken). дальше »
2019-2-10 09:00 | |
|
|
Bitcoin Price Weekly Analysis: BTC Could Rebound To $4,000
Bitcoin price formed a significant support near the $3,345 level and jumped sharply against the US Dollar. There was a break above a crucial bearish trend line with resistance at $3,380 on the 4-hours chart of the BTC/USD pair (data feed from Kraken). дальше »
2019-2-10 08:08 | |
|
|
Ethereum Price Weekly Analysis: ETH Skyrockets, Dips Remain Supported
ETH price formed a solid support at $100 and started a strong uptrend against the US Dollar. There was a break above a crucial bearish trend line with resistance at $104 on the 4-hours chart of ETH/USD (data feed via Kraken). дальше »
2019-2-10 07:28 | |
|
|
Why the Bitcoin Price Will Reject the Bulls and Crash Even Lower
While financial forecasters are predicting a bullish 2019 for the bitcoin price, the cryptocurrency first needs to fight strong technical barriers in the near-term. It is becoming difficult for bitcoin bulls to initiate a substantial push towards the $3,480-barrier and beyond. дальше »
2019-2-5 00:50 | |
|
|
Bitcoin Price Weekly Analysis: BTC Rebound Approaching Crucial Resistance
Bitcoin price formed a support base near $3,370 and recovered higher above $3,450 against the US Dollar. There was a break above a major contracting triangle with resistance at $3,440 on the 4-hours chart of the BTC/USD pair (data feed from Kraken). дальше »
2019-2-3 08:00 | |
|
|
Ethereum Price Weekly Analysis: ETH Facing Uphill Task Near $114
ETH price recovered a few points, but it is facing a lot of hurdles near $114 against the US Dollar. There was a break above a major bearish trend line with resistance at $107 on the 4-hours chart of ETH/USD (data feed via Kraken). дальше »
2019-2-3 07:08 | |
|
|