Новости о Above Major [ Фото новости ] [ Свежие новости ] | |

Ethereum Price Analysis: ETH Could Jump If It Closes Above 100 SMA
ETH price is forming a decent support near the $134 level against the US Dollar. The price is currently moving higher and testing the key $136 resistance and the 100 hourly SMA. There is a major bearish trend line formed with resistance at $136 on the hourly chart of ETH/USD (data feed via Kraken). дальше »
2019-3-25 07:08 | |
|
|
Sluggish Bitcoin Price Creates Bullish Opportunities for Wider Crypto Market: Trader
In the past 24 hours, the Bitcoin price has remained stable above the $4,020 mark, unable to break out above a key resistance level at $4,200. Meanwhile, a handful of crypto assets and tokens recorded gains in the range of 5 to 30 percent. дальше »
2019-3-24 19:15 | |
|
|
Ethereum Price Weekly Analysis: Buy ETH With Break Above $138
ETH price declined recently, but it found a strong support above $132 against the US Dollar. The price recovered and it is now facing a solid resistance near the $137-138 zone. There is a major breakout pattern formed with resistance at $138 on the 4-hours chart of ETH/USD (data feed via Kraken). дальше »
2019-3-24 07:08 | |
|
|
Bitcoin (BTC) Price Remains Vulnerable Below $4,000
Bitcoin price rebounded nicely from the $3,875 support area against the US Dollar. The price traded above the $3,950 level, but it seems to be struggling near the $4,000 resistance. There is a major bearish trend line in place with resistance at $4,000 on the hourly chart of the BTC/USD pair (data feed from Kraken). дальше »
2019-3-23 18:00 | |
|
|
Cardano [ADA] & ICON [ICX] Price Action – ADA Outperforms After Surpassing Key Resistance Level
Cardano is the top performing major cryptocurrency over both the past seven days and the past 24 hours after starting the week rising above a key weekly resistance level. Data from Messari show the price of Cardano increasing 5. дальше »
2019-3-22 13:49 | |
|
|
Ethereum Price Analysis: ETH Turning Bullish, Targets Fresh Weekly Highs
ETH price gained traction and surpassed the key $138 resistance level against the US Dollar. The price formed a strong support near the $136 level before climbing above $138. This week’s major bearish trend line was breached with resistance near $138 on the hourly chart of ETH/USD (data feed via Kraken). дальше »
2019-3-21 07:08 | |
|
|
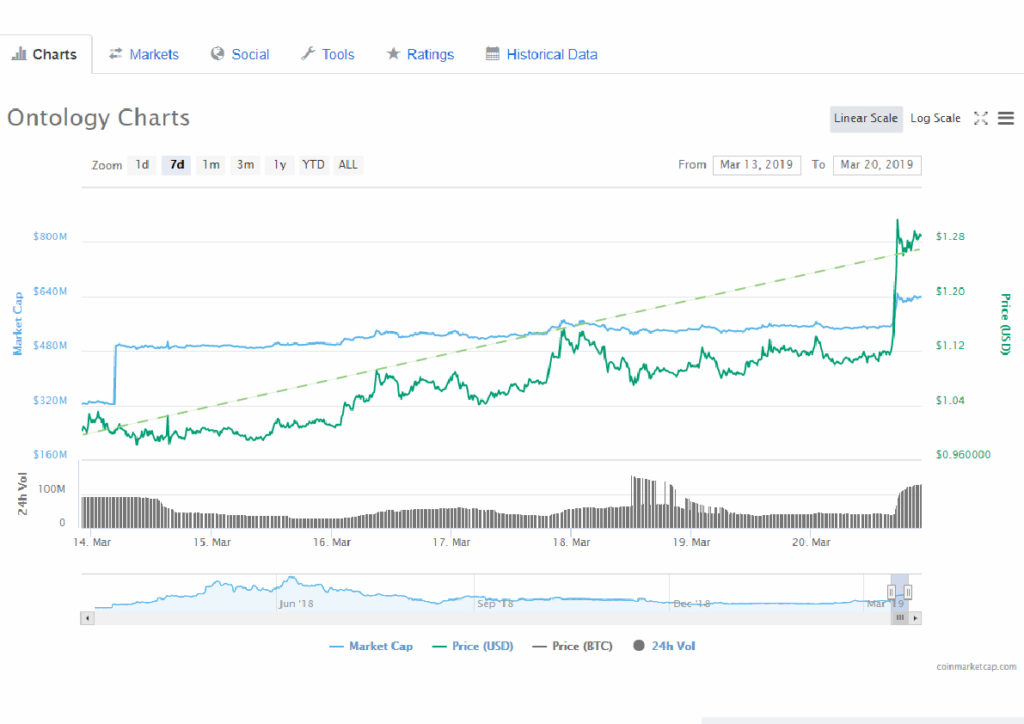
Ontology (ONT) and Tezos (XTZ) Welcoming Double Digit Increase: Latest News Summary
With the crypto-pioneer and largest by market capitalization among thousands of coins – Bitcoin (BTC) standing above the major $4,000. 00 against the US Dollar, various crypto values are making their moves above resistances. дальше »
2019-3-21 00:43 | |
|
|
Ripple Price Analysis: XRP Could Decline To $0.3000 As Sellers Take Control
Ripple price is under pressure below the $0. 3150 and $0. 3200 resistance levels against the US dollar. The price is struggling to stay above the $0. 3100 support and it could decline sharply. There is a major bearish trend line in place with resistance at $0. дальше »
2019-3-20 08:00 | |
|
|
$50 Billion VanEck: Don’t Worry – Bitcoin’s Not Going Away
VanEck, the major New York City exchange-traded fund (ETF) provider with $47 billion worth of assets under management, remains confident that despite its fall from above $19,500 to its current mark near $4,000, “Bitcoin is not going away. дальше »
2019-3-20 22:00 | |
|
|
Ethereum Price Analysis: ETH Turned Vulnerable Below $140
ETH price failed to climb above the $140-141 resistance area and declined against the US Dollar. The price even broke the $137 support level and traded to a new weekly low near $135. This is a major bearish trend line formed with resistance at $140 on the hourly chart of ETH/USD (data feed via Kraken). дальше »
2019-3-19 07:08 | |
|
|

Bitcoin Price Analysis: Slow Grind Could Lead to Short Squeeze
Last Friday, we discussed a macro resistance level bitcoin would likely test. The level was tested three times prior and immediately rejected. Now, for the fourth time, we find ourselves situated above the level as we wait to see if our support holds:Figure 1: BTC-USD, Daily Candles, Fourth Test of Macro ResistanceThe first three attempts to hold support above the black, broken resistance have been stifled with relatively high amounts of volume. дальше »
2019-3-19 01:17 | |
|
|
Ethereum Price Weekly Analysis: ETH Primed For Further Gains
ETH price broke a major resistance area near $133-134 to climb higher against the US Dollar. The price settled above the key $134 resistance to move into a positive zone. There was a break above a major contracting triangle with resistance at $133 on the 4-hours chart of ETH/USD (data feed via Kraken). дальше »
2019-3-17 07:18 | |
|
|
Bitcoin (BTC) Price Watch: Weekend Rally And Possible Run To $4,200
Bitcoin price gained traction and broke the $3,850 and $3,900 resistance levels against the US Dollar. The price rallied recently and even climbed above $4,000 before correcting lower. There is a major bullish trend line formed with support at $3,940 on the hourly chart of the BTC/USD pair (data feed from Kraken). дальше »
2019-3-16 18:00 | |
|
|
Bitcoin Up 3% as Crypto Adds $10 Billion in 1 Week: Can the Rally Continue?
Overnight, the bitcoin price surged 3 percent against the U. S. dollar above the $4,000 mark as major crypto assets in the likes of ethereum, litecoin, and bitcoin cash recorded gains in the range of 6 to 18 percent. дальше »
2019-3-16 12:27 | |
|
|
Bitcoin Price Analysis: Could Three Times Be the Charm for This Resistance Level?
Bitcoin remains in its tightly coiled range as the market continues its sideways trend for the third week in a row. While macro support has been tested three times recently, we have yet to test the overhanging macro resistance:Figure 1: BTC-USD, Daily Candles, Narrow RangeThe blue zone outlined above shows a very strong zone of support that, over the last few weeks, has seen three strong tests and has led to a slowly upward-drifting market consolidation. дальше »
2019-3-16 01:56 | |
|
|
Bitcoin (BTC) Price Watch: Important Reversal Signs Emerge
Bitcoin price made a few swing moves above the $3,800 and $3,830 supports against the US Dollar. The price managed to settle above the $3,850 level and the 100 hourly simple moving average. This week’s major bearish trend line with resistance at $3,845 was breached on the hourly chart of the BTC/USD pair (data feed. дальше »
2019-3-15 09:38 | |
|
|
Crypto Market at Major Crossroads: Litecoin (LTC), BCH, TRX, ADA Price Analysis
The total crypto market cap rebounded recently and revisited the $129. 0B resistance area. Litecoin (LTC) price gained nearly 5% and it seems like it could test $58 or $60. Bitcoin cash price is trading sideways below the $130 resistance level. дальше »
2019-3-13 09:00 | |
|
|
Bitcoin Price Analysis: Low Time Frames Show Signs of Life Amid Weekly Tests
Bitcoin continues to coil tightly within its range-bound market as the bulls and bears fight it out to see which is most dominant. On the lower time frames (TF), bitcoin is managing to find support:Figure 1: BTC-USD, 2-Hour Candles, Low TF SupportThe zone outlined by the green line in Figure 1 represents local support that has kept the market afloat for the last week and a half. дальше »
2019-3-13 22:26 | |
|
|
Bitcoin Slips Below $3,900: What This Means For Its Dominance And Price Reaction From Major Altcoins
In the last 24 hours, Bitcoin has broken a key support position of around $3,900. This follows a long bearish trend beginning during the weekend, triggered by the cryptocurrency’s failure to climb above $4,000. дальше »
2019-3-12 11:50 | |
|
|
Bitcoin Price Analysis: New High Paves Potential Reversal Setup
After days and days of consolidation, bitcoin finally managed to break a new high for the first time in almost two weeks. This new high, so far, has been short lived, however, as it was almost immediately sold into by eager bears:Figure 1: BTC-USD, 4-Hour Candles, New HighOur current 4-hour candle is seeing a relatively easy retracement after days and days of an upward grind. дальше »
2019-3-9 02:08 | |
|
|
$6 Billion Crypto Surge Propels Bitcoin Toward Key Hurdle
The cryptocurrency market surged by $6 billion on Tuesday, propelling litecoin to a new yearly high and launching bitcoin one step closer to a major hurdle it needs to cross before it can slay its historic bear market. дальше »
2019-3-6 01:28 | |
|
|

As Court Reconvenes for QuadrigaCX, Questions Surround Empty Cold Wallets
As QuadrigaCX’s legal counsel descends on the courtroom in Halifax, Nova Scotia, for another round of legal proceedings, the court monitor’s third report on QuadrigaCX’s finances — specifically its revelation that the exchange’s cold wallets are empty — lays out some hopeful avenues for fund recovery — and some frustrating dead ends. дальше »
2019-3-5 20:20 | |
|
|
Ethereum [ETH] Price Prediction: Will We Break Out Above the Recent $170 High?
Long-Term Outlook A look at the Weekly chart in logarithmic form for Ethereum shows that the price hit the major resistance area near $170, coinciding with the 21-period moving average and got pushed back It created a bearish inverted hammer, followed by two small bearish candles. дальше »
2019-3-5 13:29 | |
|
|
Dogecoin Price Analysis: DOGE Is Trading Inside a Symmetrical Triangle, When Will the Breakout Occur?
Long-Term Outlook A look at the Weekly chart for Dogecoin shows that price is trading inside the major support area near $0. 0019 formed by previous lows and has found support right above the 200-period MA. дальше »
2019-3-4 19:59 | |
|
|
XRP Price Prediction: XRP Is Trading Inside a Symmetrical Triangle, When Will the Breakdown/Out Occur?
Long-Term Outlook A look at the Weekly chart for XRP shows that price is trading at $0. 32, slightly above the major support area near $0. 27. The previous week’s candle had a large upper wick, indicating that sellers have the upper hand. дальше »
2019-3-3 21:19 | |
|
|
Stellar Price Prediction: XLM Has Bounced on the Support Line, Where Is It Heading Now?
Long-Term Outlook A look at the Weekly chart for XLM in logarithmic form shows that price is trading above the major support area is $0. 06-$0. 07, currently trading at $0. 086. Furthermore, the price is facing very close resistance from the 200-period moving average and trading below the 21 and 50 MAs and the Ichimoku Cloud. дальше »
2019-3-1 14:59 | |
|
|
Dow Struggles as US Stock Market Wrestles with Cooling Trump Economy
The Dow and wider U. S. stock market struggled for direction Thursday after talks between President Donald Trump and North Korea’s Kim Jong Un ended abruptly, raising the specter of a new confrontation with the hermit kingdom. дальше »
2019-3-1 19:30 | |
|
|
Bitcoin Price Watch: BTC Could Rally Above $4,000 If It Breaks $3,900
Bitcoin price declined sharply below the $3,750 support and tested $3,650 against the US Dollar. The price bounced back from the $3,653 low and broke the key $3,750 resistance. There was a break above a major bearish trend line with resistance at $3,785 on the hourly chart of the BTC/USD pair (data feed from Kraken). дальше »
2019-2-28 09:30 | |
|
|
Dow Futures, Bitcoin Diverge as Stock Market Waits for ‘Lying’ Cohen’s Trump Bombshell
Dow futures traded down ahead of the US stock market’s opening bell as three major geopolitical events left Wall Street on edge. The bitcoin price, meanwhile, held steady above $3,800 while the crypto market bid farewell to the once-prominent “Coinbase effect. дальше »
2019-2-28 17:18 | |
|
|
Markets Update: Support Turns Into Resistance for Leading Cryptocurrencies
Following Sunday’s sudden rally and retracement, most leading crypto assets have produced sideways consolidation just below the support ranges established during the previous week. The major exceptions to the trend are XRP and ONT, both of which appear to have held above last week’s support zones. дальше »
2019-2-26 14:55 | |
|
|
XRP Price Prediction: Price Is Back at the Major Support Area, Where Is It Going Next?
Long-Term Outlook: A look at the Weekly chart for XRP shows that price is trading at $0. 3, slightly above the support area near $0. 28. Last week’s candle was an inverted hammer with a very long upper wick, indicating that the bears are trying to gain control. дальше »
2019-2-25 12:54 | |
|
|
Major Exchange Faces System Overload as Bitcoin (BTC) Plummets After Yesterday’s Surge
The crypto markets plummeted today following yesterday’s price surge that was widely seen as being highly bullish by many analysts. Yesterday’s sharp and sudden surge sent Bitcoin above $4,000, which had previously been a strong level of resistance for BTC. дальше »
2019-2-25 22:30 | |
|
|
Bitcoin Price Weekly Analysis: BTC’s Bullish Break Looks Real Towards $4,500
Bitcoin price extended gains and broke the $3,950 and $4,000 resistance levels against the US Dollar. The price traded to a new 2019 high above $4,100 and it could continue to rise in the near term. дальше »
2019-2-24 09:00 | |
|
|
Ethereum Price Weekly Analysis: ETH Sets New 2019 High, Eyes $175
ETH price finally broke the $149 and $150 resistance levels and gained pace against the US Dollar. The price traded above the $160 resistance and formed a new 2019 high above $165. There is a major bullish trend line formed with support near $148 on the 4-hours chart of ETH/USD (data feed via Kraken). дальше »
2019-2-24 08:00 | |
|
|
Ripple Price Analysis: XRP Signaling Bearish Extension In Short Term
Ripple price failed to stay above the $0. 3250 and $0. 3200 support levels and declined against the US dollar. This week’s followed major bullish trend line was breached with support near $0. 3245 on the hourly chart of the XRP/USD pair (data source from Kraken). дальше »
2019-2-22 08:00 | |
|
|
Bitcoin Price Watch: BTC Readies For Bullish Acceleration Above $4,000
Bitcoin price is well supported on the downside near the $3,900 and $3,850 supports against the US Dollar. The price is likely to accelerate gains above the $3,975 and $4,000 resistance levels. There is a major bullish trend line formed with support at $3,900 on the hourly chart of the BTC/USD pair (data feed from. дальше »
2019-2-21 09:30 | |
|
|

Bitcoin Price Touches $4K On Biggest Daily Volume Since May
The Bitcoin price succeeded in holding above $3900 February 20 after a sudden bull run brought the largest trading volumes since May 2018. Bitcoin Volume Sets 9-Month Record Data from Coinmarketcap confirmed the return to form for both price and volume over the past 72 hours, Bitcoin rising around 10 percent February 18 and touching the $4000 mark on Bitstamp yesterday. дальше »
2019-2-20 18:00 | |
|
|
Bitcoin Price Analysis: Consolidation Breaks Out Into Macro Resistance Test
Over the course of the last 10 days, bitcoin has managed to rally nearly 20% in value as it burst through two major resistance levels and is now beginning the test of a major macro level:Figure 1: BTC-USD, Daily Candles, Macro ResistanceWe can see a clear, descending supply-and-demand channel that governed the market for the last two months. дальше »
2019-2-20 01:38 | |
|
|
Litecoin Price Prediction: Is LTC Going to Break Above $50, or Will It Make a Double Top?
Long-Term Outlook A look at the Weekly chart for Litecoin shows that the price of LTC/USD is currently trading within the major resistance area found near $50, formed by previous support. Price is currently trading at $49. дальше »
2019-2-19 16:34 | |
|
|
Ethereum Price Analysis: ETH Rally Takes Break, Uptrend Intact Above $140
ETH price extended the recent rally and traded above the $144 and $148 resistances against the US Dollar. The price traded close to the $150 level and later started consolidating gains above $145. дальше »
2019-2-19 07:08 | |
|
|
Bitcoin Price Watch: BTC Turned Buy On Dips, Uptrend Intact
Bitcoin price formed a strong support near the $3,550 level and traded higher against the US Dollar. There was a break above a major bearish trend line with resistance at $3,610 on the hourly chart of the BTC/USD pair (data feed from Kraken). дальше »
2019-2-18 09:30 | |
|
|

TRON Price Prediction: TRX Has Retraced Back to the Minor Support Area, Will It Start a Move Upward in the Short-term?
Long-Term Outlook A look at the weekly chart for TRX shows that the price is slightly below the major resistance area at $0. 03, currently trading at $0. 024. Price has found support above the 21-period MA and is trading below the 50-period MA, which has offered resistance to price. дальше »
2019-2-17 13:04 | |
|
|
Ethereum Price Weekly Analysis: ETH Primed To Rise Further Above $125
ETH price started a major consolidation after a nasty upward move above $120 against the US Dollar. There is a contracting triangle in place with resistance at $124 on the 4-hours chart of ETH/USD (data feed via Kraken). дальше »
2019-2-17 07:28 | |
|
|
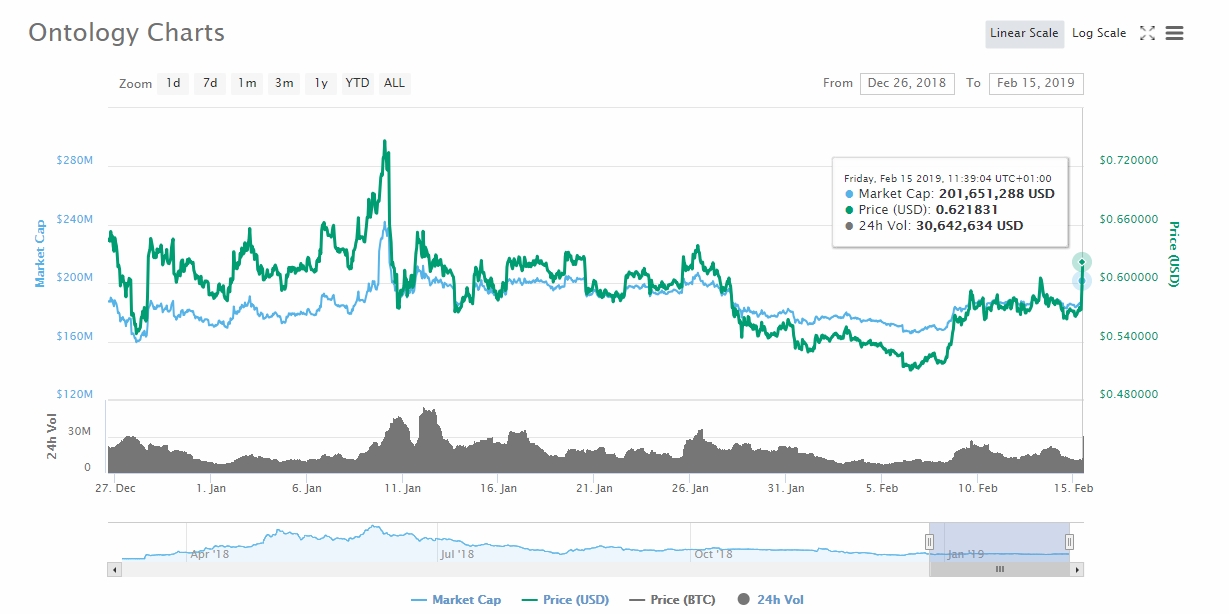
Ontology (ONT) and Tezos (XTZ) Marking Highest Gains: About the Coins
In just a couple of hours, the pair ONT/USD made it above the major $0. 6000 level jumping from $0. 5666 to $0. 6218 counting 10. 60% gain in the last 24-hours. Source: coinmarketcap Among the top-25 coins by market capitalization Ontology’s blockchain token is marking the highest increase for the day [February 15th , 2019]. дальше »
2019-2-15 14:26 | |
|
|
Ethereum Price Analysis: ETH Losing Bullish Momentum, Downsides Limited
ETH price struggled to stay above the $121 and $119 support levels against the US Dollar. This week’s followed major bullish trend line was breached with support at $121 on the hourly chart of ETH/USD (data feed via Kraken). дальше »
2019-2-15 07:08 | |
|
|
Dow Sneaks Higher, Bitcoin Price Holds the Line as US Stock Market Clears Major Hurdle
The Dow added to Tuesday’s blockbuster rally, and the S&P 500 cleared a key technical hurdle in what is shaping up to be another strong day for the US stock market. The bitcoin price, meanwhile, entered the day with a minor decline but held firmly above its interim support level. дальше »
2019-2-13 17:00 | |
|
|
TRON Price Prediction: TRX / USD Has Broken Down From a Short Term Triangle Pattern, Where Is the Coin Heading Next?
Long-Term Outlook A look at the weekly chart for TRX shows that the price is currently trading at $0. 024 after retracing from the major resistance area near $0. 03. Price is trading above the 21-period MA but below the 50-period MA, which is offering resistance to price. дальше »
2019-2-13 14:14 | |
|
|
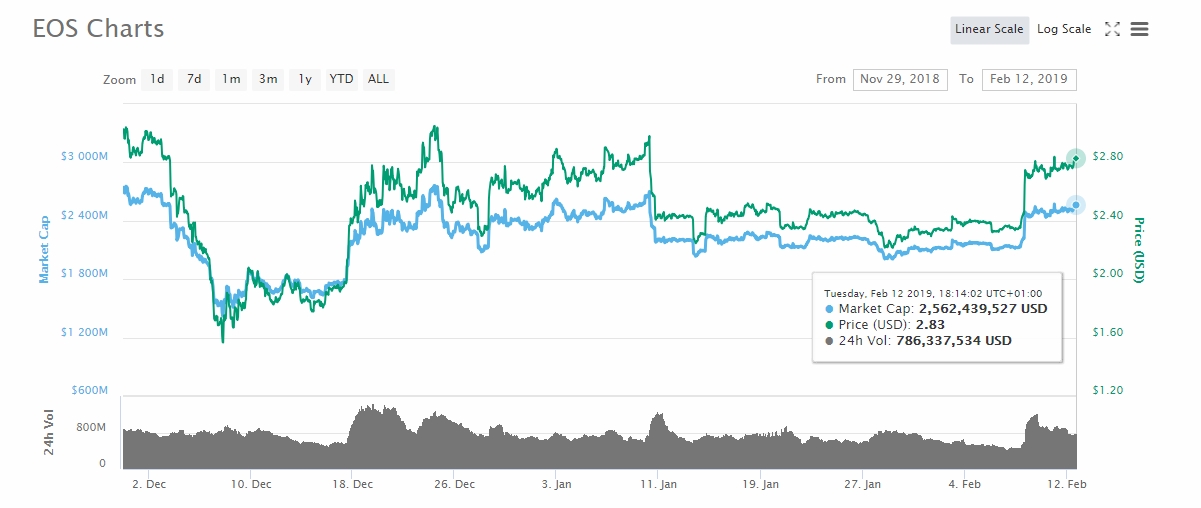
EOS (EOS) Price Initiating Break Above the Daily Range Bound
The fifth largest cryptocurrency by market capitalization EOS (EOS) is returning the beginning of January losses as the pair EOS/USD is closing in to the major $2. 80 which depending on the standing acted as a clear supportive or resisting level. дальше »
2019-2-12 21:11 | |
|
|