2020-6-17 13:00 |
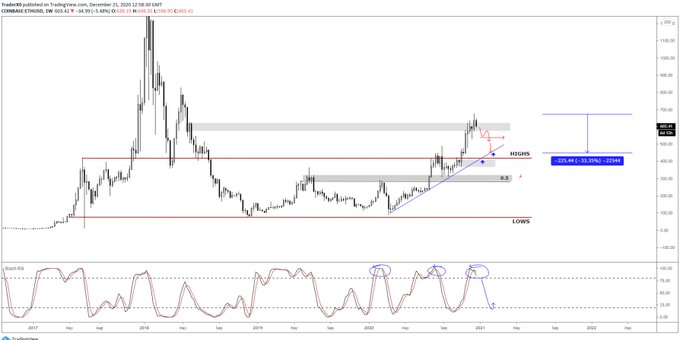
Historical analysis shows that Ethereum is on the verge of a brutal six-month correction after nearly doubling since the start of the year. Ethereum Is Primed to See a Six-Month Correction Ethereum is primed to see a six-month correction, despite rallying by nearly 200% since March’s capitulation lows. An analyst recently shared the chart below accentuating this sentiment. It shows that Ethereum has a pattern where it rallies during the first half of the year, then corrects during the second half. Should this trend persist, Ethereum is primed to see a six-month correction that will likely bring it back into the ~$100 range. “If ETH follows its cycle this time then high of the year could be in & we’ve 6 month correction,” the analyst who shared the chart wrote. Ethereum price analysis by cryptocurrency trader ‘Edward Morra’ (@edwardsmorra_BTC on Twitter). The chart from TradingView.com On-chain analytics also show that Ethereum is on the verge of moving lower. Earlier this month blockchain data firm Glassnode revealed that ETH’s recent price performance has allowed 80% of the cryptocurrency’s total supply to move into a region of “profit.” This metric is derived by determining the prices at which all Ethereum addresses accumulated the cryptocurrency. The last time this metric was this high, Ethereum retraced from ~$290 to $88 in the span of six weeks. And the time before that, the cryptocurrency retraced from around $360 to $120 over the course of six months. Ethereum on-chain metrics shared by cryptocurrency analytics firm Glassnode (@Glassnode on Twitter). Blockchain data firm IntoTheBlock revealed that three out of seven of its core metrics are currently printing “bearish” signals. The metrics currently “bearish” are as follows: in the money, which tracks the profitability of holders; large transactions, the number of high-volume ETH transactions; and smart price, which effectively attempts to derive an implied price of ETH by checking order book data. Bitcoin Is Bearish As Well The expectations of an Ethereum correction can be corroborated by equally as bearish Bitcoin analyses. Charlie Morris, the founder of ByteTree, reported on June 14th that there currently is a convergence of on-chain data showing that prices will dive: “1-week network velocity down to 454%, 5-wk 556%. Tx value down, av tx size down, fees down, MRI shot to pieces. Why the lack of interest? Can’t see price holding up. Fair value <$7k,” Morris wrote. #bitcoin on chain stats are dire. 1 week network velocity down to 454%, 5wk 556%. Tx value down, av tx size down, fees down, MRI shot to pieces. Why the lack of interest? Can’t see price holding up. Fair value <$7k. https://t.co/5O82LldYl6 — Charlie Morris (@AtlasPulse) June 14, 2020 A top trader shared those expectations, referencing how commonplace it is for Bitcoin to retrace upwards of 30% during bull markets: “I’ve been seeing more and more comments saying BTC going down to support is unlikely because that’d be too big a drop. That’s not how BTC works. Retraces are short and vicious. Crashes even more so. 40% down is not unlikely, it’s happened before, it’ll happen again.” Featured Image from Shutterstock Price tags: ethusd History Shows That Ethereum Is on the Verge of a Brutal 6-Month Correction
Similar to Notcoin - Blum - Airdrops In 2024
Ethereum (ETH) на Currencies.ru
|
|


