2021-6-9 19:03 |
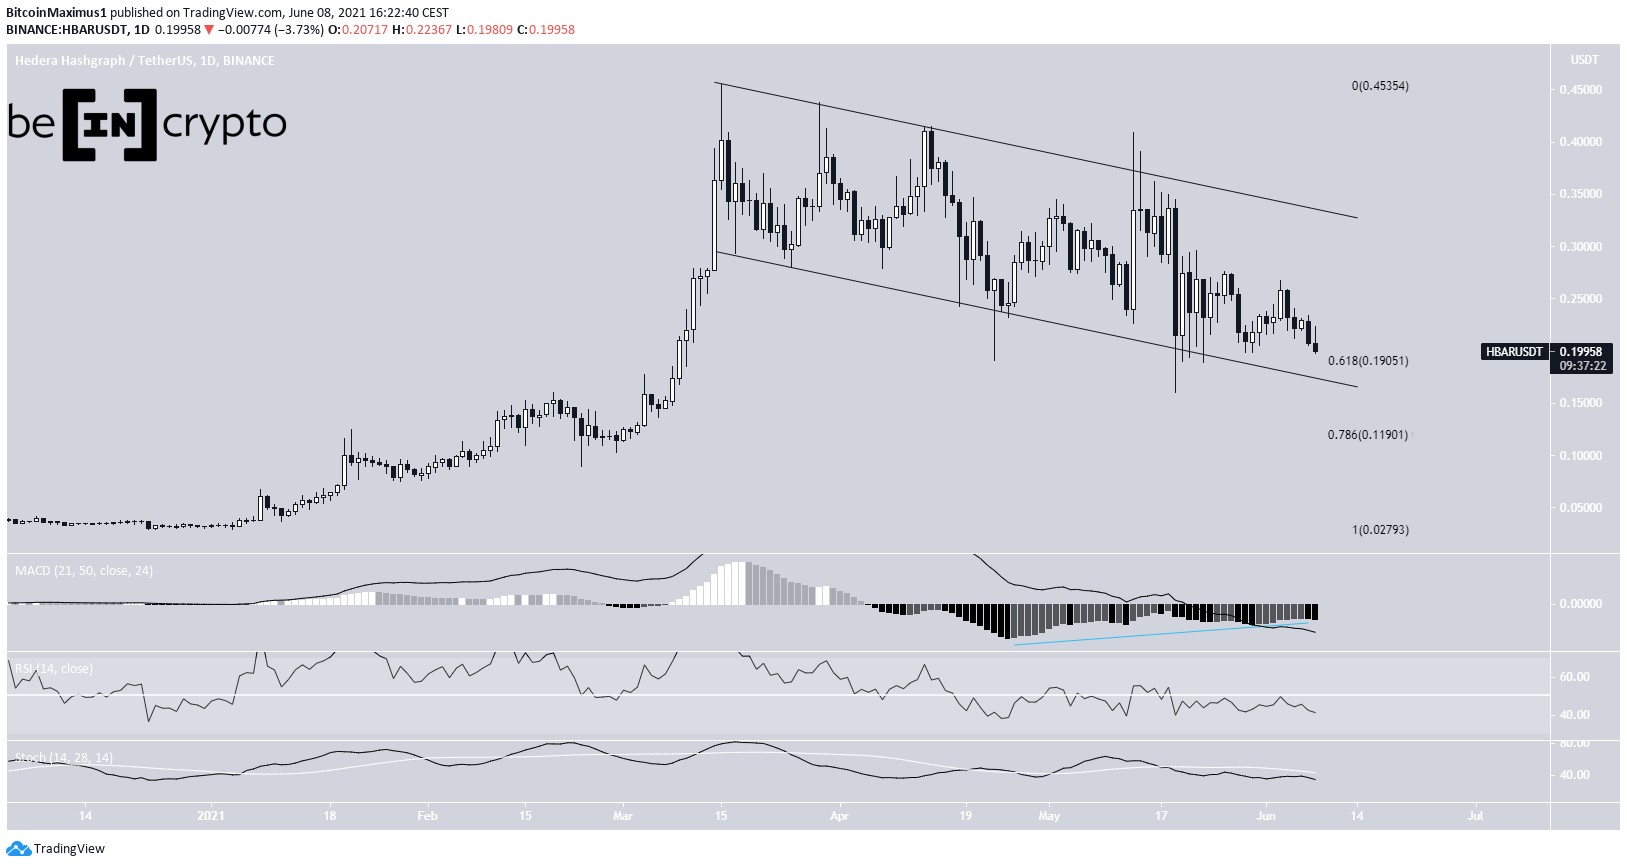
Hedera Hashgraph (HBAR) has been trading inside a descending parallel channel since reaching an all-time high price of $0.455 on March 15.
The ongoing decrease looks like a corrective structure, thus an eventual breakout from the current pattern is expected.
Ongoing decreaseHBAR has been moving downwards since March 15. At the time, it had just reached a new all-time high price of $0.455.
The drop has been significant, since the token has lost more than 50% of its value.
However, it also looks extremely corrective, due to being gradual, choppy, and contained inside a descending parallel channel. Therefore, it would be unlikely for this decrease to be the beginning of a new bearish trend.
Currently, HBAR is trading just above the 0.618 Fib retracement support level at $0.19.
A breakdown from the channel would take it to the next support at $0.119.
Technical indicators are providing some bullish signs, such as the bullish divergence in the MACD histogram. However, both the RSI & Stochastic oscillator are moving downwards.
Chart By TradingViewCryptocurrency trader @DLinkbull tweeted an HBAR chart, stating that the ensuing upward movement could mirror that of MATIC. While there is potential for a significant upward movement, a breakout from the channel would be required first.
Source: Twitter HBAR/BTCThe HBAR/BTC chart looks more bullish than its USD counterpart. Since breaking out above the 480 satoshi support area in March, the token has been trading in a range between 480 and 780 satoshis. The latter is also the all-time high resistance area.
Most recently, it reached the resistance area on May 13 before dropping sharply.
Technical indicators are bullish, since the RSI is above 50, the MACD is positive and the Stochastic oscillator has made a bullish cross.
However, neither is moving upwards, indicating a lack of momentum.
Chart By TradingViewThe shorter-term twelve-hour chart shows a breakout from a descending resistance line (dotted) and its validation as support afterwards. The touch of the line (green icon) also coincides with an ascending support line.
In addition to this, the MACD is moving upwards.
Therefore, the trend can be considered bullish as long as the token is trading above this line. If not, it is possible that it will drop in order to validate the 480 satoshi area once more.
Chart By TradingViewFor BeInCrypto’s latest bitcoin (BTC) analysis, click here.
The post HBAR Continues Ongoing Correction Since Reaching All-Time High appeared first on BeInCrypto.
Similar to Notcoin - Blum - Airdrops In 2024
Hedera Hashgraph (HBAR) на Currencies.ru
|
|
