2023-11-18 19:05 |
Bitcoin recently gave a bearish signal, which ultimately failed to produce a meaningful pullback.
Due to the technical failure, historical data suggests that in only a matter of a month BTCUSD could set a new all-time high and reach a target of $85K per coin. Here’s why.
Why Failed Bearish Technicals Produce Bullish BreakoutsIn technical analysis, certain patterns are considered characteristically bearish or bullish. For example, the ascending triangle is a typically bullish-leaning pattern, but only breaks upward 63% of the time. The other 37%, the pattern breaks down bearish.
Because of the nature of how orders and stop losses are stacked on either side of a pattern’s trend lines, a failed bullish pattern can be extremely bearish and vice-versa. Dissecting further, since the pattern was visibly bullish, it could have attracted more long-side positioning that is forced to unwind lower.
Recently, Bitcoin price gave a bearish TD9 sell setup on the weekly TD Sequential. However, no major correction followed. When this occurs, it often results in a sizable move in the opposite direction of the signal.
More simply put, the failed TD9 sell setup could mean a massive move higher. And how high price could go and how fast might shock you.
Market Timing Tool Hints At Bitcoin Rally To $85KThe TD Sequential is a market timing indicator developed by Thomas Demark. A TD9 setup or TD13 countdown is a specific sequence of candles that signal trend exhaustion.
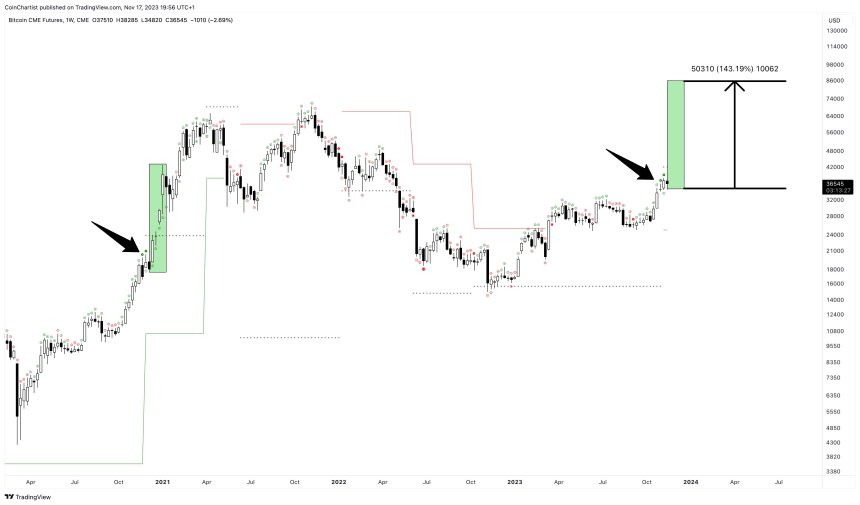
Back in 2020 when this same signal failed, Bitcoin blasted off to new all-time highs above $20,000 and then some. It rallied 143% in the four weeks following the signal and over 300% more in total when it was all said and done.
If the same magnitude move followed this recently failed TD9 sell setup, Bitcoin price would reach $85,000 by the end of December. Another 300% beyond the current all-time high in BTCUSD would take the top cryptocurrency to over $200,000 per coin in total.
In terms of lower prices, the indicator also provides TDST support and resistance levels. These levels rise and fall with each completed TD setup. This latest setup caused TDST floor price support to raise from $10,000 to $25,000, reducing the chances that BTCUSD ever trades below that price again.
In December 2020, after a failed TD9 sell setup, #Bitcoin did another 143% in 4 weekly candles, pushing above former ATH resistance
The same magnitude move would bring $BTC to another new ATH at $85,000 before the end of the year
Still doubt my thesis we’ll see ATHs in 2023? pic.twitter.com/GwCXEaY1II
— Tony “The Bull” (@tonythebullBTC) November 17, 2023
origin »Bitcoin price in Telegram @btc_price_every_hour
Bitcoin (BTC) на Currencies.ru


|