Ethereum is Defying a 3 Year Market Structure; Claims Early Investor

2020-11-8 23:00

Ethereum is currently expressing some immense signs of strength as the cryptocurrency rallies higher while Bitcoin drifts lower.

This is the first time in weeks that the cryptocurrency has risen while Bitcoin’s price drifts lower. DeFi blue chips have also been rallying higher.

The DeFi sector has been one of the biggest beneficiaries of Ethereum’s immense strength throughout the past day, with many posting V-shaped recoveries that appear to mark their recent lows as a long-term bottom.

If these tokens continue rallying higher and mark their recent lows as a long-term bottom, there’s a strong possibility that yield farming and trading volumes on decentralized exchanges will begin rising once again.

This will greatly benefit ETH, driving transaction volume, fees, and further network utility to the blockchain.

One well-known Ethereum whale – with a supposed average entry of below $2.00 per ETH – is now noting that the cryptocurrency is defying “3-years of market structure” with this latest push higher.

He notes that any pullbacks in the near-term are unlikely to last long and will likely be followed by immense upside.

Ethereum Holds Above $450 as Bulls Eye Upside 

At the time of writing, Ethereum is trading down just under 2% at its current price of $450. Bulls have been ardently trying to defend this price region throughout the past few hours.

This level was previously resistance, but it could soon transform into support if bulls continue holding it above here throughout the day.

If flipped into a strong support level, this price could provide bulls with a great base to grow upon.

The next key level to watch will be $500, as a rejection or break above this level will be significant and set the tone for where the market will trend in the months ahead.

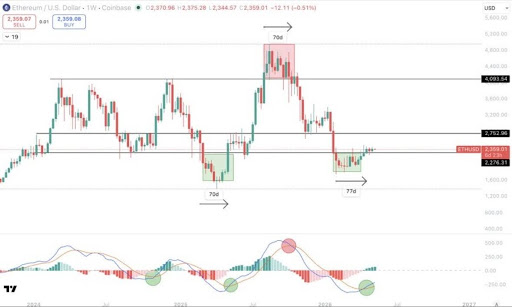
Early ETH Investor: Upside is Likely Imminent for the Token

One early Ethereum investor who goes by the pseudonym “Tetranode” explained in a recent tweet that the cryptocurrency is currently defying a multi-year bearish market structure – indicating that serious upside could be imminent.

“Still on track, the cup formed and now I expect a handle. If there is a pullback as we hit the 460-480 range, it’s probably not going to last very long. Defying 3-years of market structure is an exercise in futility.”

Image Courtesy of Tetranode.

The coming few days should provide insight into Ethereum’s mid-term outlook, as a sustained bout of trading above $450 will likely provide it with some serious momentum.

Featured image from Unsplash. Pricing data from TradingView.

Similar to Notcoin - Blum - Airdrops In 2024

origin »

Bitcoin (BTC) на Currencies.ru

$ 67930.94 (+0.10%)
Объем 24H $35.501b
Изменеия 24h: -2.08 %, 7d: -4.60 %
Cегодня L: $67037.9 - H: $68531.34
Капитализация $1339.139b Rank 1
Цена в час новости $ 15382.41 (341.61%)

bitcoin drifts lower ethereum cryptocurrency time year

bitcoin drifts → Результатов: 14


Фото:

Bitcoin’s Critical Support is Degrading, and It’s Bad for Altcoins

Bitcoin is currently struggling to garner any notable upwards momentum as its price drifts towards its key support at $11,000 Sellers have been in firm control of its trend throughout the past several days and weeks Where it trends in the near-term will likely depend almost entirely on whether or not bulls can continue defending against a decline below $11,000 One analyst is noting that a key technical support level that was bolstering BTC is […]

2020-8-28 21:00


Фото:

Ethereum Taps a “Structure Defining” Level as Traders Foresee Major Downside

Ethereum’s recent decline has led it down to $200 as it continues underperforming both Bitcoin and many of its other peers Analysts are now noting that the crypto is trading at a “structure defining” level Its technical weakness may be enough to define its market structure as being bearish, thus catalyzing further near-term losses Ethereum has continued underperforming the aggregated cryptocurrency market as it drifts down to its key support at $200, leading analysts and […]

2020-5-5 23:00


Фото:

Bitcoin Price Analysis: Slow Grind Could Lead to Short Squeeze

Last Friday, we discussed a macro resistance level bitcoin would likely test. The level was tested three times prior and immediately rejected. Now, for the fourth time, we find ourselves situated above the level as we wait to see if our support holds:Figure 1: BTC-USD, Daily Candles, Fourth Test of Macro ResistanceThe first three attempts to hold support above the black, broken resistance have been stifled with relatively high amounts of volume.

2019-3-19 01:17


Фото:

Bitcoin Price Analysis: Could Three Times Be the Charm for This Resistance Level?

Bitcoin remains in its tightly coiled range as the market continues its sideways trend for the third week in a row. While macro support has been tested three times recently, we have yet to test the overhanging macro resistance:Figure 1: BTC-USD, Daily Candles, Narrow RangeThe blue zone outlined above shows a very strong zone of support that, over the last few weeks, has seen three strong tests and has led to a slowly upward-drifting market consolidation.

2019-3-16 01:56


Фото:

Bitcoin Price Analysis: After Sudden Upswing, Bitcoin Price Drifts Downward

Last week, we saw a violent move to the upside as bitcoin rallied 11% over the course of one day. Since peaking in the upper $3,600s, bitcoin has seen close to zero bullish follow-through, and the price has begun to drift downward over the course of the last week:Figure 1: BTC-USD, Hourly Candles, Downward DriftDownward-drifting markets like this can often be a sign that distribution is taking place.

2019-2-15 00:21


Фото:

Bitcoin Price Analysis: New Low on Low Volume Breeds Potential Bullish Set-up

Bitcoin sits precariously perched at the bottom of the annual market low and many bitcoin investors aren’t sure what to make of it. Although the market seems to be continuing its drift to new lows with greater and greater ease, there are a couple of bullish signals worth considering while the market continues to consolidate: Figure 1: BTC-USD, Daily Candles, New Market LowOn Friday, June 29, 2018, for the first time this year, the daily candles closed below the annual low of $6,000s.

2018-7-1 19:35