2019-4-25 03:11 |
After a 2x upward movement in price, Ethereum (ETH), the world’s biggest smart-contract blockchain, has formed its first bullish golden cross since Feb. 19, 2017.
Understanding the Moving AveragesPrior to diving into a price analysis of the second largest cryptocurrency in terms of market cap, some of the technical terms used in this study will be defined for a better comprehension of the data.
A moving average (MA) is an indicator that analyzes different data points by generating a sequence of averages. As described in Investopedia:
“It helps smooth out price action by filtering out the ‘noise’ from random short-term price fluctuations.”
Since it follows a trend, it is based on past prices and can determine pivot points in a market trend.
A golden cross occurs when a short-term moving average crosses above a long-term moving average signaling a potential bullish breakout. Many analysts see this pattern as one of the most definitive and strong buy signals that could start a long-term bull market. On the other hand, a death cross appears on a chart when an asset’s short-term moving average crosses below the long-term moving average indicating the potential for a major selloff.
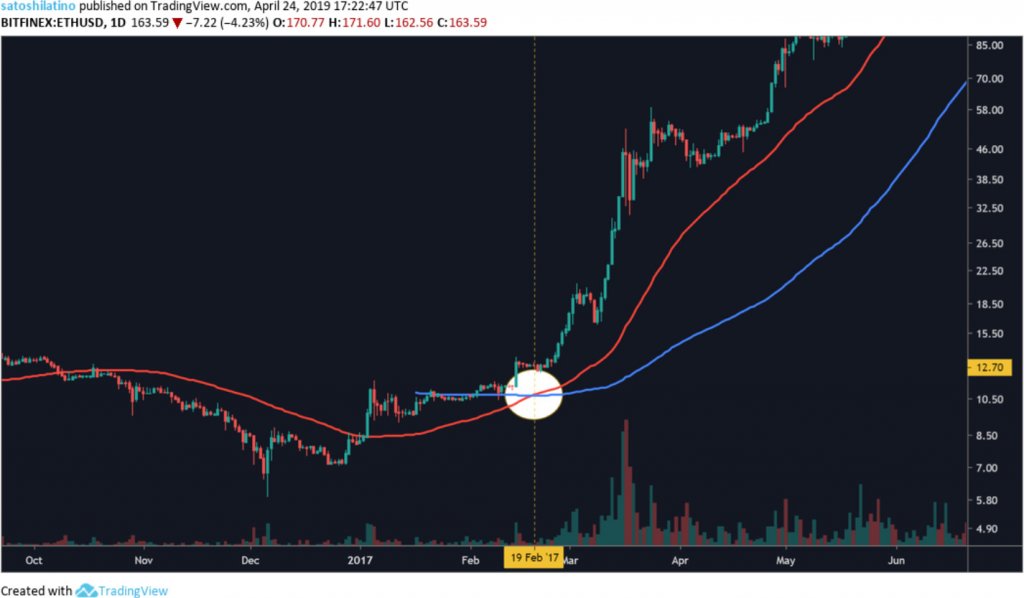
Ethereum Technical AnalysisOn Feb. 19, 2017, the 50-day moving average crossed above the 200-day moving average creating a golden cross on Ethereum’s daily chart for the first time since it was released in Jul.y 30, 2015. The milestone was a result of a 115.72 percent rally from the Dec. 6, 2016, low of $5.86 all the way up to $12.7, when the cross developed. Part of the entire move was characterized by a consolidation period that lasted almost two months before the price finally broke out.
Source: TradingViewWhat came after Ethereum’s first “holy grail” was a parabolic advance that lasted 11 months. The market valuation of this cryptocurrency went from $12.70, when the pattern formed, to an all-time high (ATH) of $1,424.3 on Jan. 13, 2018, which represented an 11,114.96 percent move.
During this bull rally, ETH’s price corrected on multiple occasions. By July 16, 2017, for instance, succeeding a high of $412.21 on June 12, 2017, it had retraced 66.98 percent and on Sept. 2, 2017, after hitting a double top the price suffered a 49.8 percent crash. These pullbacks, however, weren’t significant enough to change the overall trend of this crypto.
Source: TradingViewIt was until the death cross of Apr. 10, 2018, when the 50-day MA moved below the 200-day MA that the market gave a clear signal that the trend was about to change from bullish to bearish. The signal came after a 74.86 percent drop from the ATH of Jan. 13, 2018.
Ethereum’s bear market officially started upon the emergence of the death cross as it began a steady decline that lasted 11 months. From the all-time high of Jan. 13, 2018, when it was trading at $1,424.3 to the low of Dec. 15, 2018, when it was worth $83.17, ETH recorded a 94.16 percent loss of its value.
Related: Blockchain Investors Lose Billions to Projects with ‘No Evidence’The huge devaluation was heavily influenced by the ongoing sale of ETH tokens received by many startups during the initial coin offering (ICO) mania of 2017. As the bear market continued to unravel and most of the assets in these startups were in cryptos, they began liquidating their holdings in order to remain afloat. Satis Group, an STO advisory firm, conducted a study in 2017 that concluded that over 80 percent of ICOs failed.
Source: TradingVIew The Long Awaited Bull Might be HereThe world’s biggest smart-contract blockchain has been rapidly recovering from the low of Dec. 15, 2018. As a matter of fact, on Apr. 19, 2019, a golden cross formed on the daily chart after a 109.93 percent bullish momentum. The cross could be signaling a definitive upward turn that might be setting Ethereum up for future upward movement.
Source: TradingViewIt’s worth noting that no indicators can truly predict the future. Even though many traders see a golden cross pattern as one of the strongest signals that could start a bull market, it also regularly fails to be validated and change a trend. It is extremely important to put into perspective other metrics and analyses before getting vested in the market.
Disclaimer: None of the information you read in this article should be taken as investment advice.
The post Ethereum forming bullish technical indicators appeared first on CryptoSlate.
origin »Bitcoin price in Telegram @btc_price_every_hour
Ethereum (ETH) на Currencies.ru
|
|