Ethereum (ETH) Wave Count Suggests a Long-Term Bottom Has Been Reached

Ethereum (ETH) Wave Count Suggests a Long-Term Bottom Has Been Reached
фото показано с : beincrypto.com

2022-7-23 17:30

Ethereum (ETH) has nearly doubled in price since its June 18 lows. It is possible that a local bottom is in place.

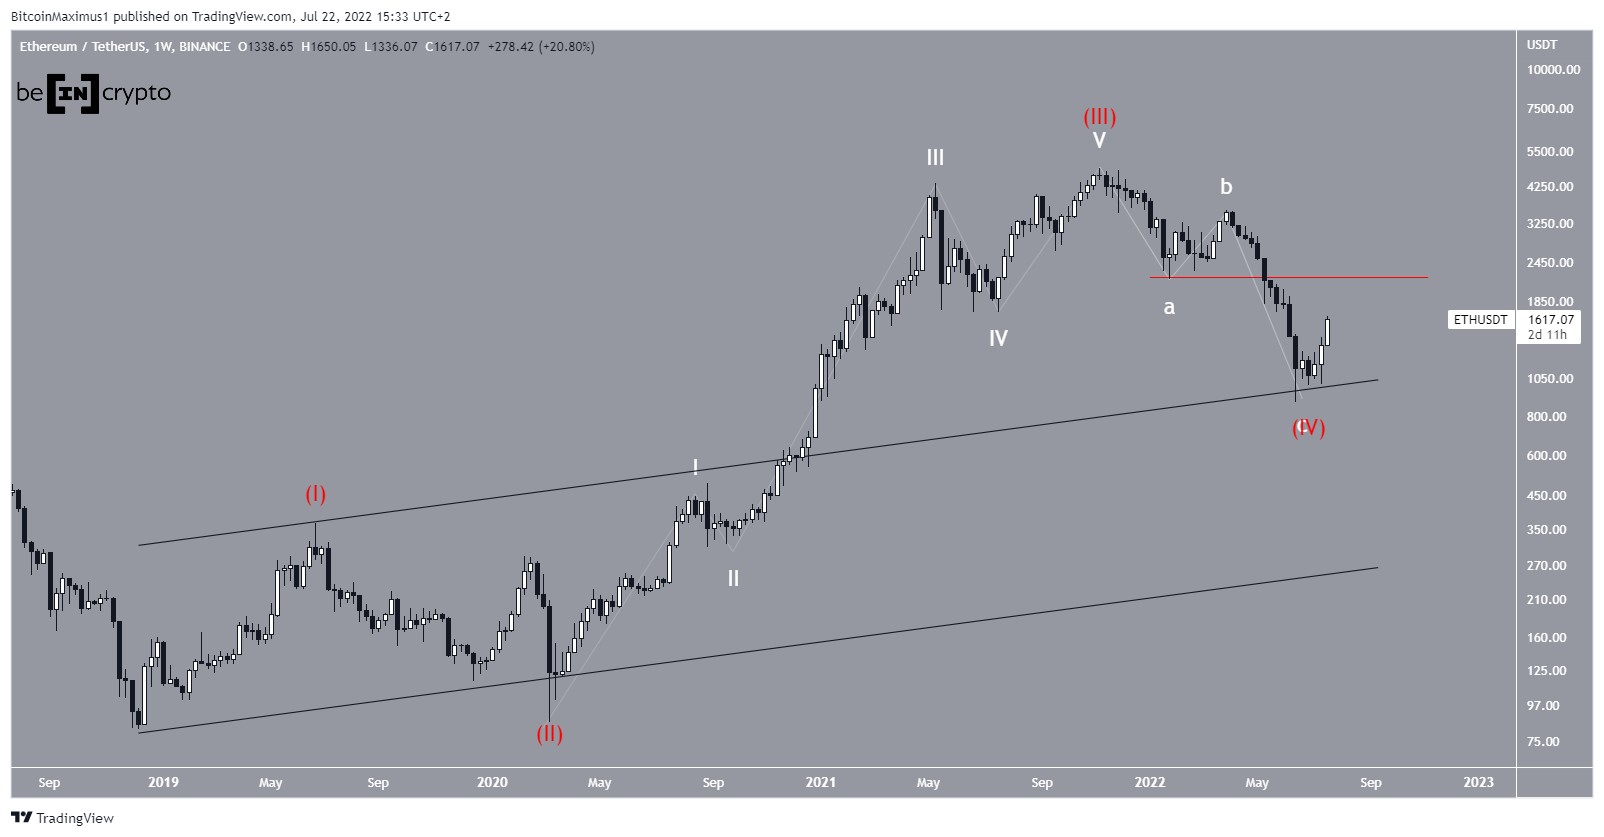
The most likely long-term count suggests that ETH completed a five-wave upward movement (white) between March 2020 and Nov 2021. Afterward, it seems to have completed an A-B-C corrective structure. 

In the longer-term, the aforementioned increase was likely part of wave three (red), while the ensuing correcting part of wave four, which in turn developed into a fourth-wave pullback (red). 

If the count is correct, the price has begun a new upward movement that will eventually lead to a new all-time high price. In order for the count to be confirmed, Ethereum has to move above the wave one low (red line) at $2,159.

ETH/USDT Chart By TradingView Ongoing ETH breakout

The daily chart also provides a bullish outlook, since it shows that the price has already broken out from a descending resistance line that had been in place since April 5. Additionally, the daily RSI has moved above 50 (green icon), in what is considered a sign of bullish trends. 

If the previously outlined count is correct, ETH is currently in wave one of a new five-wave upward movement (white). The sub-wave count is given in black. 

The most likely area to act as the local top is between $2,230 and $2,540. It is created by the short-term 0.5-0.618 Fib retracement resistance area (black) and the long-term 0.382 retracement resistance.

ETH/USDT Chart By TradingView Short-term movement

Finally, a closer look at the previously outlined sub-wave count shows that ETH is likely in wave three of a five-wave upward movement. So far, sub-wave three has had 1.61 times the length of sub-wave one, which is common in such structures. 

As a result, a short-term drop could follow prior to the fifth and final sub-wave. 

The possibility of a drop is also supported by the six-hour RSI, which has generated bearish divergence (green line)

ETH/USDT Chart By TradingView

For Be[in]Crypto’s latest Bitcoin (BTC) analysis, click here

The post Ethereum (ETH) Wave Count Suggests a Long-Term Bottom Has Been Reached appeared first on BeInCrypto.

Similar to Notcoin - Blum - Airdrops In 2024

origin »

Ethereum (ETH) на Currencies.ru

$ 2849.63 (+1.97%)
Объем 24H $33.748b
Изменеия 24h: 8.03 %, 7d: 11.26 %
Cегодня L: $2686.36 - H: $2875.54
Капитализация $343.15b Rank 2
Цена в час новости $ 1548.96 (83.97%)

ethereum bottom eth count reached suggests long-term

ethereum bottom → Результатов: 126


Why is ETH still bearish after Amazon and Elon Musk endorsement?

After all eyes were on Bitcoin and its recent movements to pick up from the bottom and back into bullish areas, it’s time for Ethereum to steal the show. It’s too early to tell if the same movement can be replicated by ETH but with names like Elon Musk and Amazon behind the scenes, we […] The post Why is ETH still bearish after Amazon and Elon Musk endorsement? appeared first on AMBCrypto.

2019-5-13 19:00


Bitcoin Price Vulnerable Despite 2019 High, Traders Predict Plummet to $4,200

By CCN. com: In the past 24 hours, the bitcoin price spiked by nearly five percent from $5,580 to $5,880, surpassing $5,900 at the day’s peak, fueling the cryptocurrency market. The abrupt increase in the bitcoin price was supported by a noticeable increase in daily bitcoin spot volume estimated to be around $570 million as of May 7 by OnChainFX.

2019-5-7 13:45


Фото:

Ethereum co-founder predicted the bottom for bitcoin, the future looks bright for crypto

Joseph Lubin, the co-founder of Ethereum and one of the crypto titans, accurately called the bottom of the 2018 bear market. Amidst the mass layoffs and restructuring of ConsenSys, and contrary to the “epic amount of fear, uncertainty, and doubt” in the market, Lubin asserted the industry has a “very bright” and exciting future.

2019-5-4 12:00


Ethereum Price Prediction: ETH Failed to Break Above the 21-week Moving Average, Will the Next Attempt Be Successful?

Long-Term Outlook A look at the Ethereum Weekly logarithmic chart shows that the price made a temporary bottom at $80 inside the minor support area, before starting an upward move. However, once reaching the minor resistance is at $160, it was rejected and formed a hammer candle (yellow arrow), which when found on uptrends usually indicates […] Ethereum Price Prediction: ETH Failed to Break Above the 21-week Moving Average, Will the Next Attempt Be Successful? was originally found on Cryptocurrency News | Blockchain News | Bitcoin News | blokt.com.

2019-2-27 12:04


Analyst: Bitcoin (BTC) Most Likely To Bottom At $2,400

Bitcoin Could See A Further 40% Before Bottom, Claims Trader The seemingly endless stream of harrowing crypto price predictions has continued. One trader, going by the laugh-inducing moniker “Magic Poop Cannon,” claims that Bitcoin (BTC) is most likely to find a long-term floor at and around the $2,000 (most likely $2,300-$2,400) price level — a […] The post Analyst: Bitcoin (BTC) Most Likely To Bottom At $2,400 appeared first on Ethereum World News.

2019-2-8 03:51