Ethereum (ETH) Daily Price Forecast – September 7

2018-9-7 09:28

ETH/USD Medium-term Trend: Bearish

Resistance Levels: $240, $260, $280
Support Levels: $220, $200, $180

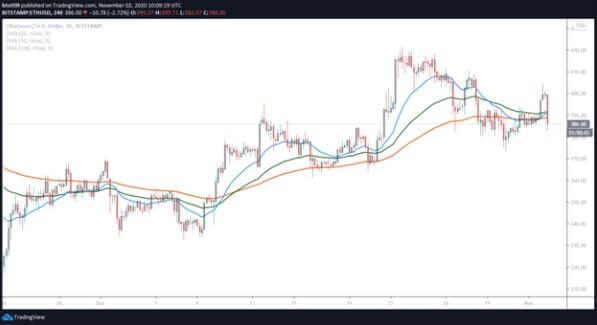
Yesterday, September 6, the price of Ethereum was in a bearish trend. The ETH price fell to its previous low of $211.11. The cryptocurrency appears to have ended the bearish pressure as the price went into a range bound movement. Traders should know that we buy low and sell high. Therefore we should initiate long trades above and stop-loss orders below the $200 price level.

As the positions reach a profitable status then we can bring our stop-loss orders to breakeven point. The price of Ethereum is expected to rise. Nevertheless, the MACD line and the signal line are below the zero line which indicates a sell signal. In addition, the price of Ethereum is below the 12-day EMA and the 26-day EMA which indicates that the bearish trend is ongoing. The Relative Strength Index period 14 is level 26 which indicates that the market is oversold suggesting bulls to take control of the market.

ETH/USD Short-term Trend: Ranging

On the 1-hour chart, the price of Ethereum is in a sideways trend. The cryptocurrency is fluctuating below and above the $230 price level. Price of Ethereum is neither below nor above the 12-day EMA and the 26-day EMA which indicates that price is in a sideways trend. The MACD line and the signal line are below the zero line which indicates a sell signal.

The views and opinions expressed here do not reflect that of BitcoinExchangeGuide.com and do not constitute financial advice. Always do your own research.

Similar to Notcoin - Blum - Airdrops In 2024

origin »

Ethereum (ETH) на Currencies.ru

$ 3573.61 (-0.07%)
Объем 24H $36.236b
Изменеия 24h: -0.95 %, 7d: 8.73 %
Cегодня L: $3523.8 - H: $3665.21
Капитализация $430.413b Rank 2
Цена в час новости $ 207.42 (1622.89%)

price eth bearish levels ethereum trend september

price eth → Результатов: 126


Ethereum Netflow Spikes To Derivatives Markets – Is a Price Swing on the Horizon?

Ethereum (ETH) has experienced a lackluster phase in recent weeks, with the asset seeing small price surges but still struggling to hold near or above the $3,000 mark after a brief rally in August. According to a recent analysis from a CryptoQuant analyst, the behind the scenes of this price struggle for ETH has been quite interesting, with the asset seeing a significant shift in its netflow.

2024-10-26 11:30


Is This Ethereum ICO Project To Blame For ETH’s Price Slump?

The Ethereum price has fallen by around -25% since its mid-March peak at around $4,100 and is currently trading just above $3,000. While this loss is in line with the broader market trend and in particular Bitcoin’s price drop of about -22% in the same time, there could be another reason for ETH’s price slump, which seems plausible since the German government only sells BTC and not ETH, and Mt.

2024-7-9 19:00


Фото:

ETH’s post-Shapella price outlook: sells outpace buys ahead of Binance withdrawals

Ethereum (ETH) price raced to an 11-month high above $2,142 on Coinbase exchange on Sunday, the major price rally for ETH coming after the cryptocurrency’s successful Shapella upgrade. But what is the latest for Ethereum after it rose despite the sell pressure that followed enabling withdrawals for staked Ether? Kaiko, a leading institutional grade crypto […] The post ETH’s post-Shapella price outlook: sells outpace buys ahead of Binance withdrawals appeared first on Invezz.

2023-4-19 23:44