2019-1-12 07:41 |
EOS/USD Long-term Trend: Bearish Resistance levels: $ 6, $7, $8. Support levels: $3, $2, $1.
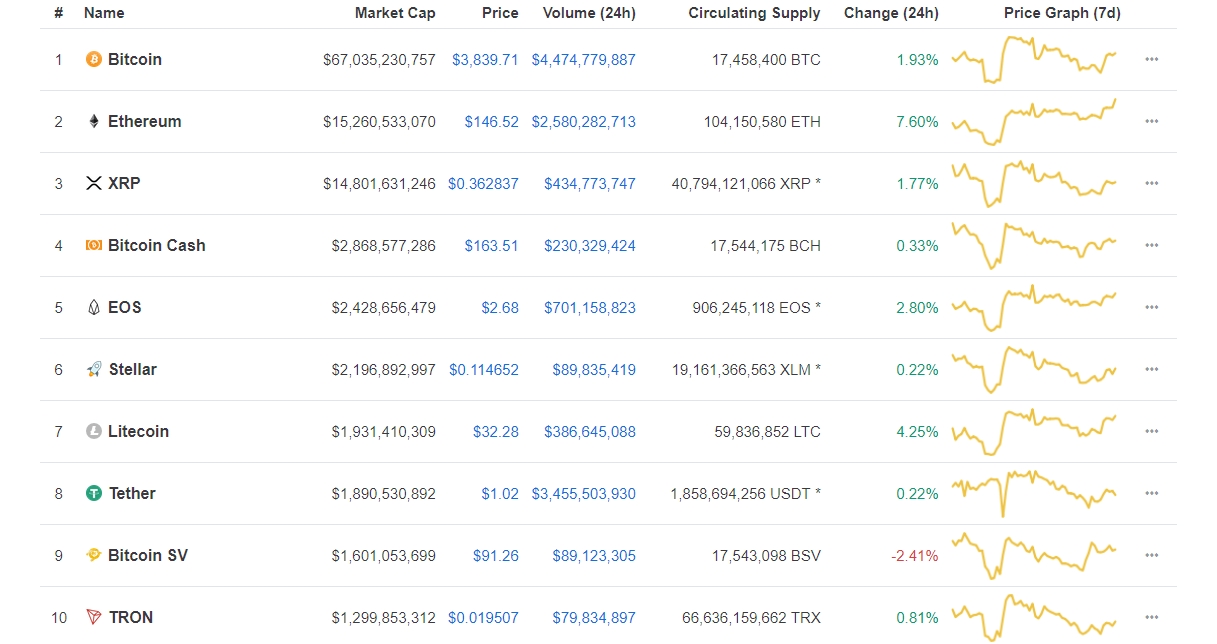
The EOS/USD pair was in a sideways trend since the beginning of January 2019. On January 1, the crypto had an opening balance of $2.62 and the crypto was range bound above the opening balance. On January 10, the price of EOS broke the 12-day EMA and the 26-day EMA to the low of $2.42. The crypto’s price is below the EMAs which indicate that the crypto is likely to fall again. If the bearish pressure continues, the crypto may revisit the previous low of $2.0 and $1.84.
From the weekly chart, the stochastic indicator is out of the oversold region but above the 60% range which indicates the price of EOS is in a bullish momentum and a buy signal.The MACD line and the signal line are below the zero line which indicates a sell signal.
The views and opinions expressed here do not reflect that of BitcoinExchangeGuide.com and do not constitute financial advice. Always do your own research.
Similar to Notcoin - Blum - Airdrops In 2024
EOS (EOS) на Currencies.ru
|
|


