2026-2-18 20:31 |
Dogecoin struggles below key moving averages, signaling weak short-term trend. A cup and handle pattern is forming, hinting at a potential breakout if the resistance breaks. Support lies near $0.08, with higher volume needed for a sustained upward move.
Dogecoin is hovering around the $0.10 mark after a shaky month that saw the price dip over 20%.
The popular meme coin has struggled to hold momentum, with trading volumes showing signs of weakness.
Even so, there are hints in the charts that a rebound could be forming.
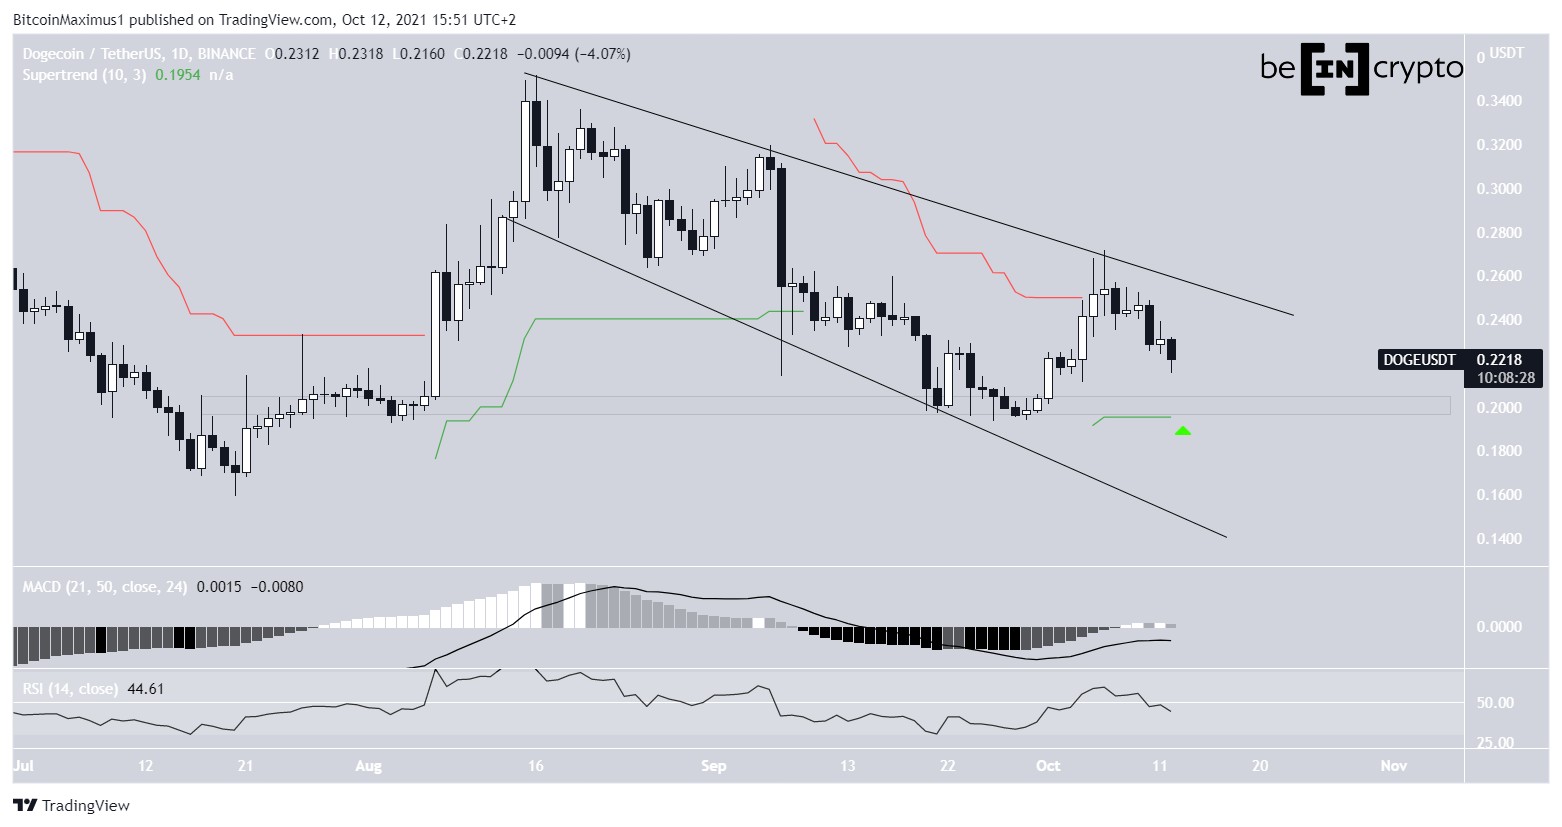
Technical analysisLooking at the moving averages, DOGE is currently below the 5-day, 10 and 20-day averages.
Dogecoin price chart | Source: TradingViewThis typically signals that the short-term trend is weak.
Traders often watch for the price to climb above these averages as an early sign of bullish momentum.
Right now, resistance is in the $0.105–$0.107 range.
A break above this level would be an important signal for those hoping for a recovery. The MACD indicator is also showing mixed signals.
The MACD line has moved above the signal line despite both being in the negative, and the histogram has turned positive, suggesting that buyers are beginning to step in after a period of inactivity.
However, volume is still modest. A strong breakout would require significantly more trading activity than the roughly $33 million seen recently.
Support remains solid at around $0.08, which has already acted as a bounce point.
This level has prevented further sharp declines and could continue to anchor the price if bearish pressure returns.
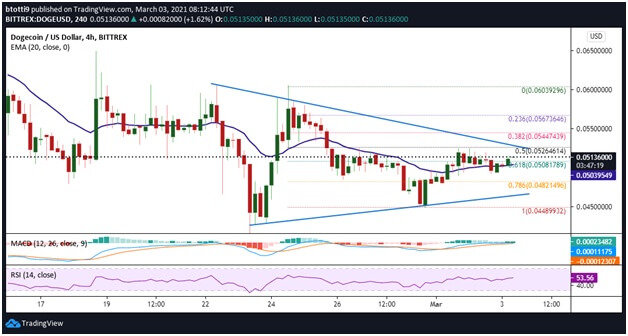
Cup and handle pattern points to possible upsideOn the daily chart, Dogecoin is forming a classic Cup and Handle pattern.
The Cup bottomed near $0.08 and then rallied toward $0.11.
The Handle is now forming near the top of the Cup, consolidating just below resistance.
Cup and handle pattern | Source: Trader Tardigrade on CoinMarketCapThis formation often precedes a breakout when the price moves above the Handle.
If Dogecoin can clear this resistance, it could push toward higher levels, reigniting optimism among traders.
Chart patterns like this are watched closely because they combine both support and momentum signals.
They show where traders are willing to buy and where sellers may step in.
In Dogecoin’s case, the pattern suggests that there is still potential for upside, but it won’t happen without stronger buying interest.
Volume and momentum will be key to confirming the breakout. Traders are likely waiting for both to pick up before committing heavily.
Even with these early bullish signs, caution is warranted.
The market has been volatile, and DOGE has lost significant value over the past year. Short-term gains are possible, but the overall trend remains fragile.
The post Dogecoin price tests $0.1 as this chart pattern hints at possible rebound appeared first on CoinJournal.
origin »Bitcoin price in Telegram @btc_price_every_hour
Dogecoin (DOGE) на Currencies.ru
|
|