2023-8-7 15:30 |
The DOGE price has cleared a significant long-term resistance area. However, it has yet to confirm the bullish trend reversal by sustaining the increase.
Moreover, the daily timeframe does not confirm that the bullish reversal has begun, since the price trades in a corrective pattern.
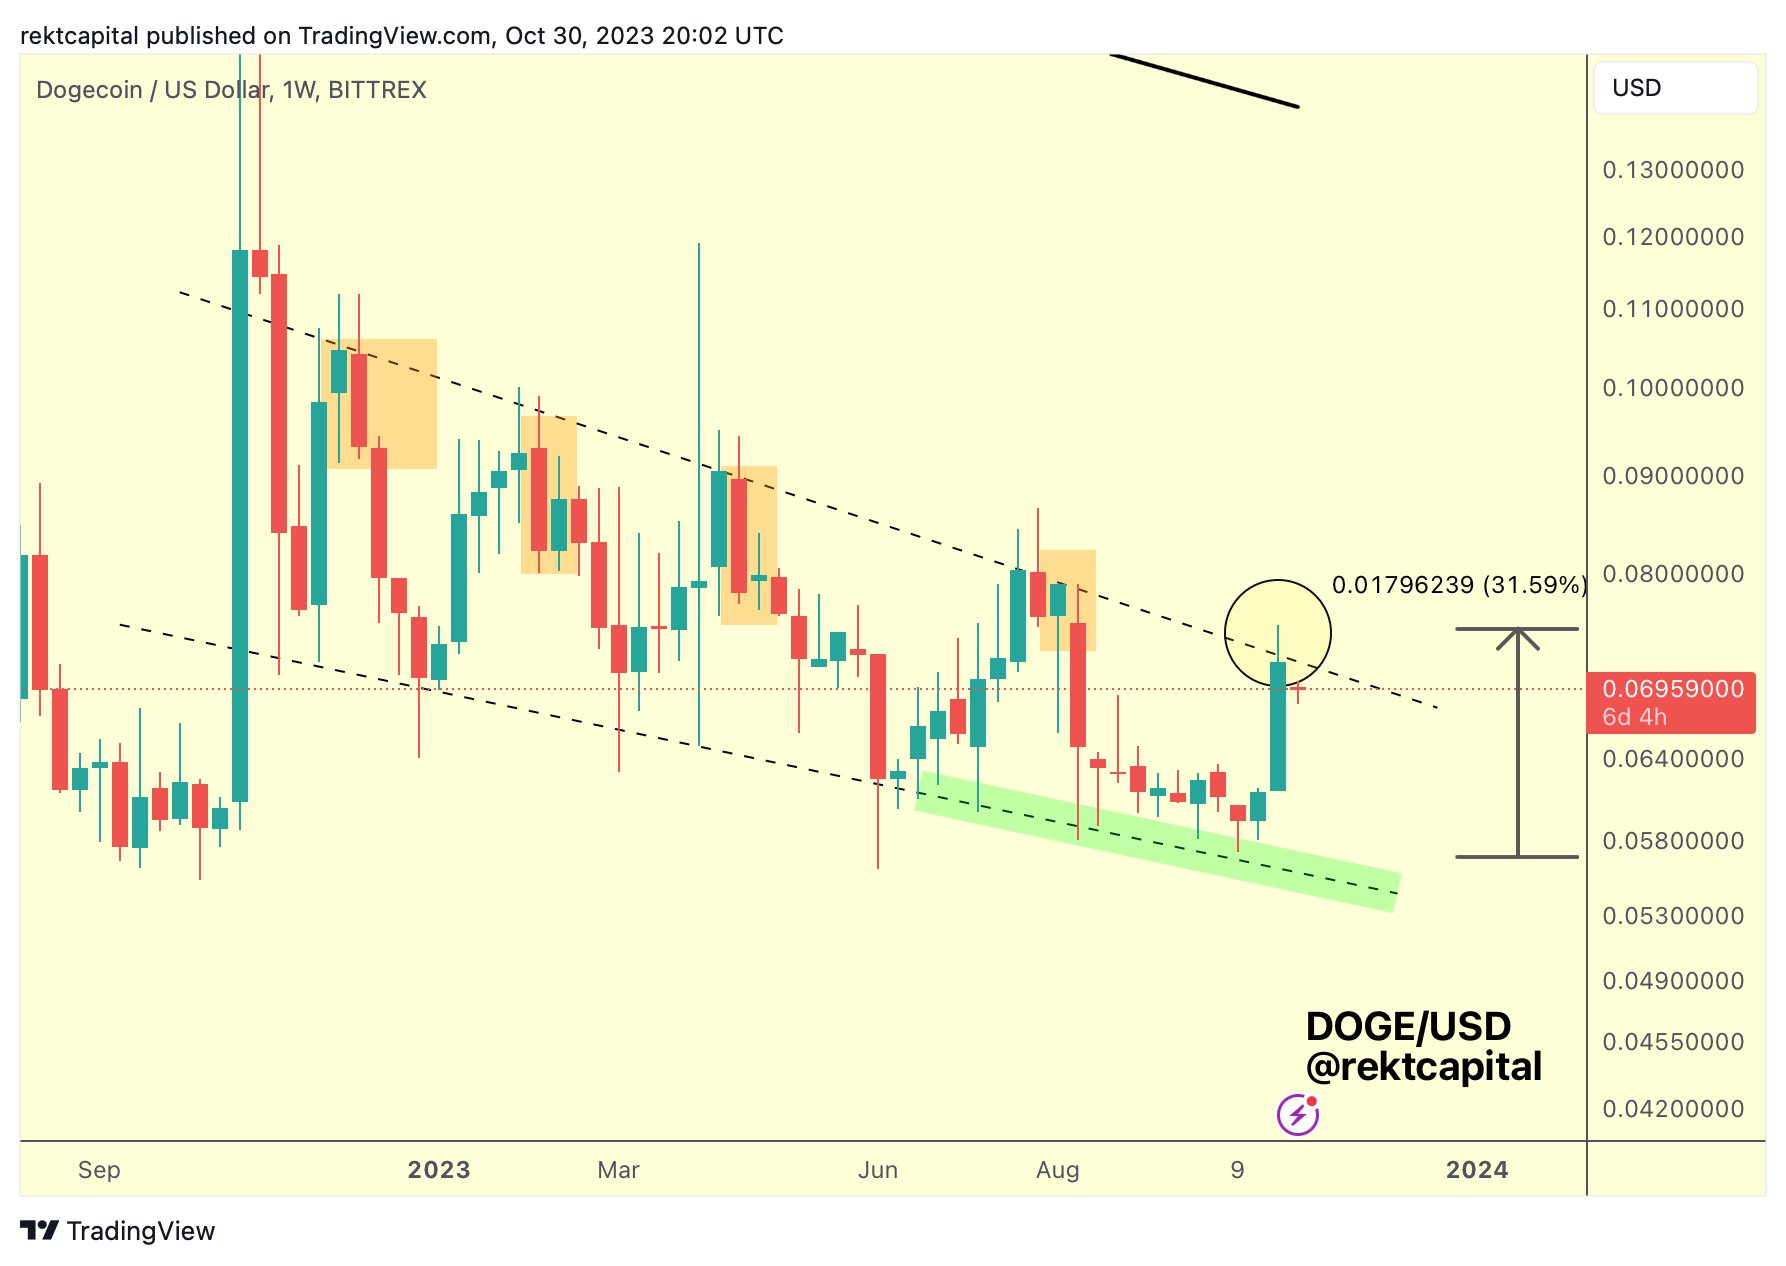
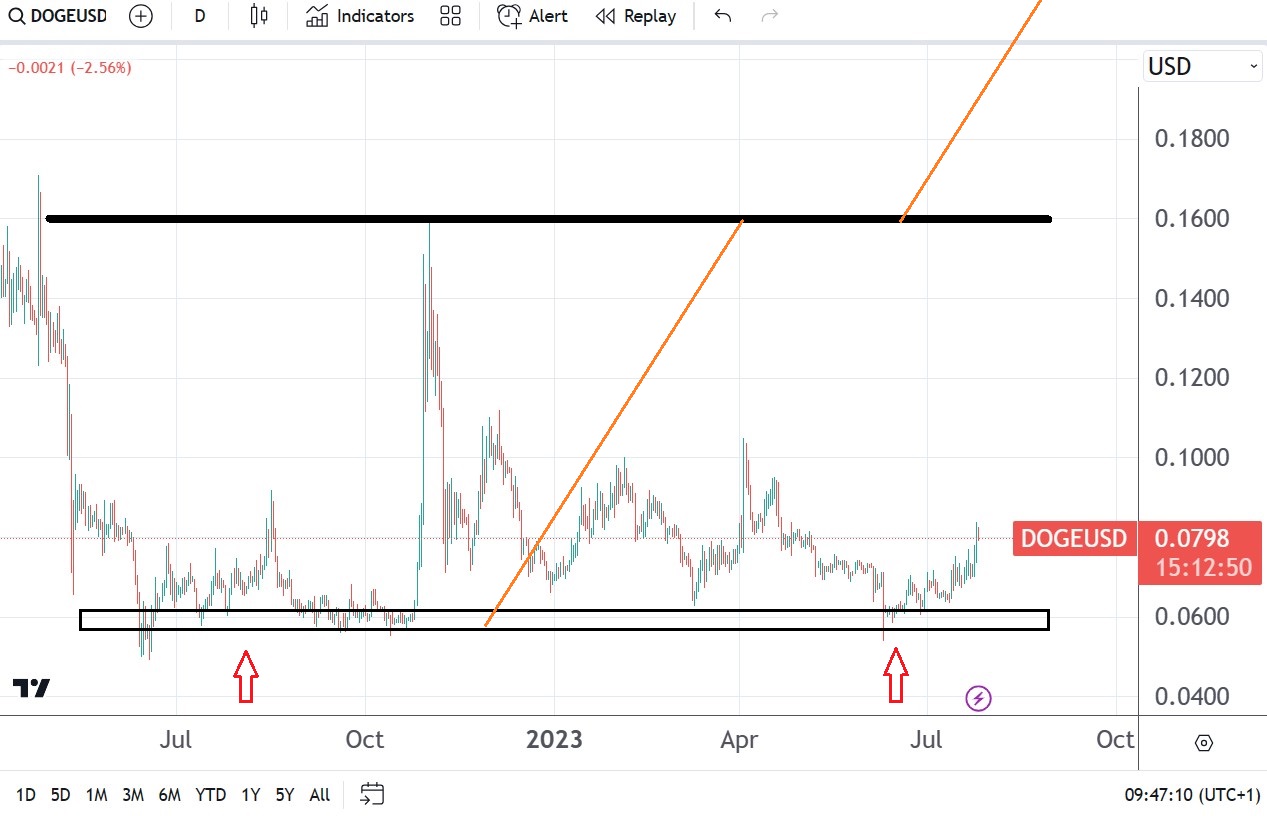
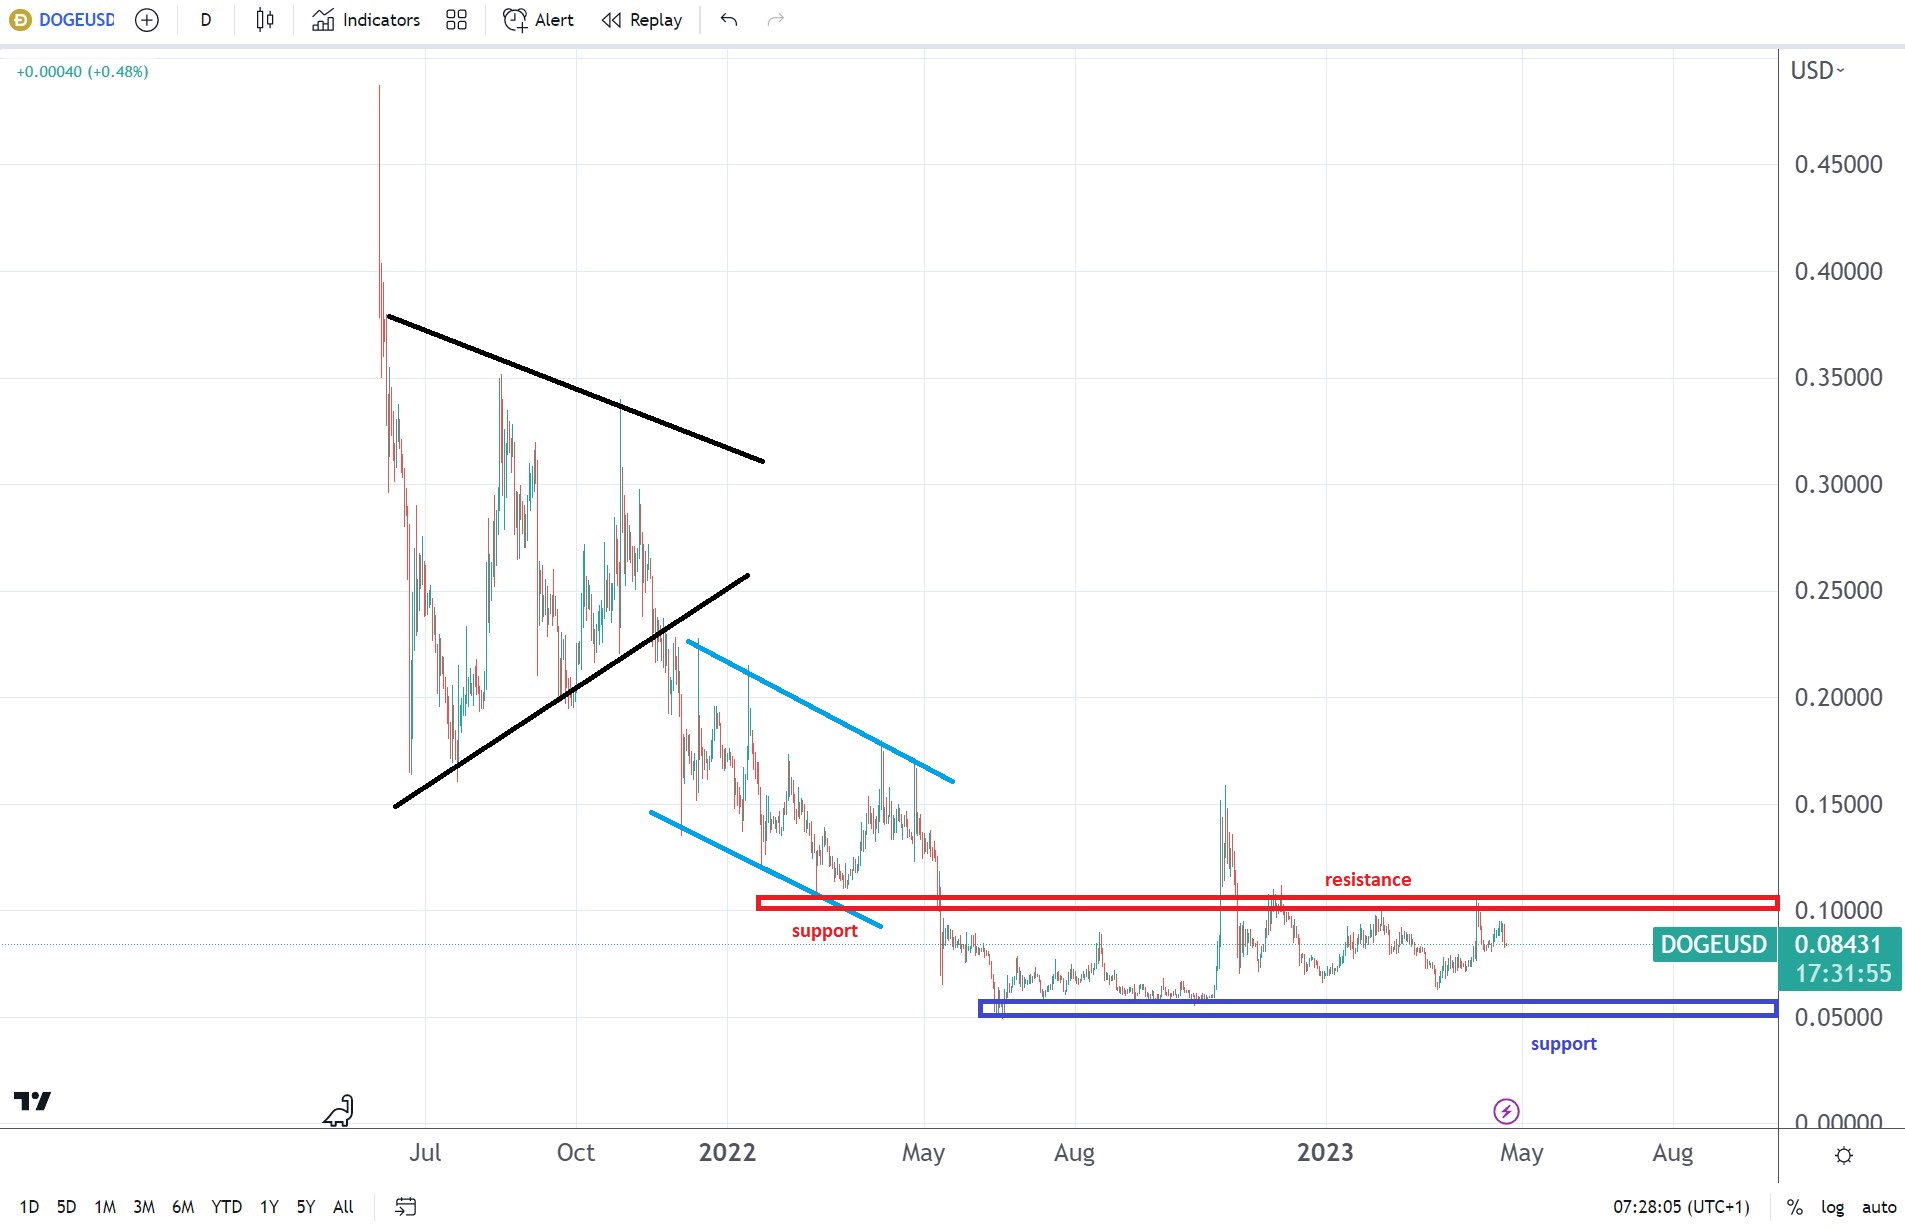
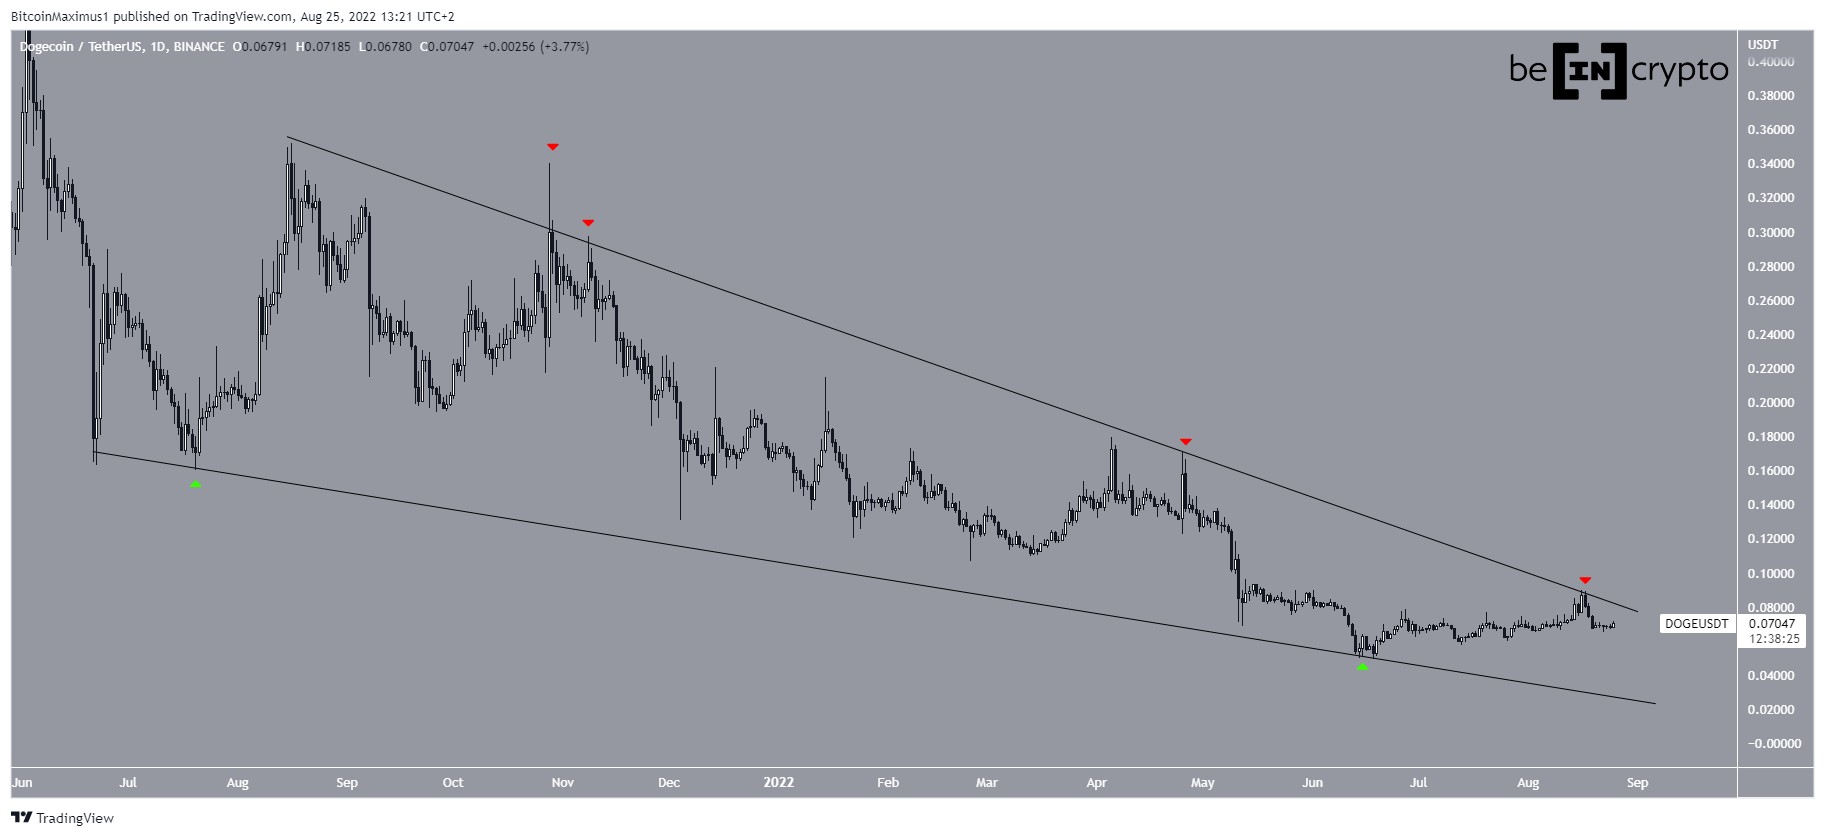
Dogecoin Price Consolidates Above Long-Term ResistanceThe technical analysis for the weekly time frame shows that the DOGE price had decreased under a descending resistance line since May 2021, when it reached an all-time high of $0.739. This decline led to a low point of $0.049 (green icon) in June 2022.
Afterward, DOGE underwent a recovery phase and began trading above the $0.060 horizontal support level. After several unsuccessful attempts over six months, the price of DOGE eventually broke above the resistance line on July 15, which had been in place for an impressive 805 days. A similar movement is seen in the DOGE/BTC pair.
Secure your future with accurate crypto forecasts. Click here.
Breakouts from long-term structures like this often signal significant price increases, indicating the end of the previous trend. This particular breakout could have occurred because of Elon Musk’s rebranding of Twitter.
However, it’s important to note that the expected price increase has not yet materialized.
DOGE/USDT Weekly Chart. Source: TradingViewThe weekly Relative Strength Index (RSI) reading does not provide a definitive conclusion. The RSI is a momentum indicator used by traders to assess whether a market is overbought or oversold, aiding in decisions regarding buying or selling an asset.
An RSI reading above 50 and moving upwards suggests that the bulls have the advantage, while readings below 50 indicate the opposite. The RSI has traded right at the 50 line for the past two weeks (green circle).
A strong bounce from the line will confirm the bullish trend reversal while a decisive decrease below it will mean that the breakout was illegitimate.
DOGE Price Prediction: Will Price Confirm Bullish Trend Reversal?The daily time frame’s technical analysis provides a mixed outlook. The main reason for this is the conflicting price action this year.
On the bullish side, the DOGE price broke out from a descending resistance line on July 24. Before the breakout, the line had been in place for 265 days. However, the price has failed to sustain the upward movement. To the contrary, it returned to validate the line as support on August 4 (green icon).
Read More: Top 11 Crypto Communities To Join in 2023
While this can be considered a common breakout and retest, the movement since the June lows has been contained inside an ascending parallel channel. Such channels usually contain corrective movements, meaning that an eventual breakdown from it is the most likely future price scenario.
If that occurs, the meme coin would fall below the resistance line, rendering the previous breakout as illegitimate. In that case, a sharp 25% decline to the June lows at $0.055 will be the most likely future price scenario.
On the other hand, a breakout from the channel will mean that the long-term breakout is valid and could trigger a 100% increase to the November 2022 highs near $0.15.
The RSI does not help confirming the trend. While the indicator is above 50, it is not mired in a bullish trend. Rather, it is just hovering barely above the line, a sign of a neutral trend.
DOGE/USD Daily Chart. Source: TradingViewTo conclude, while the long-term Dogecoin price trend is bullish, the short-term trend is still undetermined.
A breakdown from the channel will mean that the trend is still bearish, while a breakout from it will confirm the long-term bullish trend reversal and could cause a 100% increase.
Read More: Crypto Signals: What Are They and How to Use Them
For BeInCrypto’s latest crypto market analysis, click here.
The post Dogecoin (DOGE) Price Eyes $0.15 After Clearing Resistance – Is a Breakthrough Imminent? appeared first on BeInCrypto.
Similar to Notcoin - Blum - Airdrops In 2024
Resistance (RES) на Currencies.ru
|
|


