2023-3-28 00:30 |
In the past week, MANA has turned bearish, and at press time, the altcoin continued to show similar trading patterns. On higher time frames, the coin was negative, with selling strength remaining considerably higher than buying pressure.
The technical outlook also sided with the bears, as the price still showed that sellers were in control. Demand for MANA remained low, displaying a decline in accumulation.
Although in the previous-to-last week, MANA gained significant strength and dragged the price from the $0.50 zone to $0.67, it quickly experienced a retracement met with selling pressure that intensified bearish price action.
The price could continue to move south if the coin failed to remain above its crucial support level. Additionally, Bitcoin was trading above the $27,000 mark with an imminent price correction. In case of dips on the king coin’s chart, MANA is also likely to decrease in value, so buyers need to be careful. The coin’s market capitalization has fallen, indicating that selling strength was building up on the daily chart.
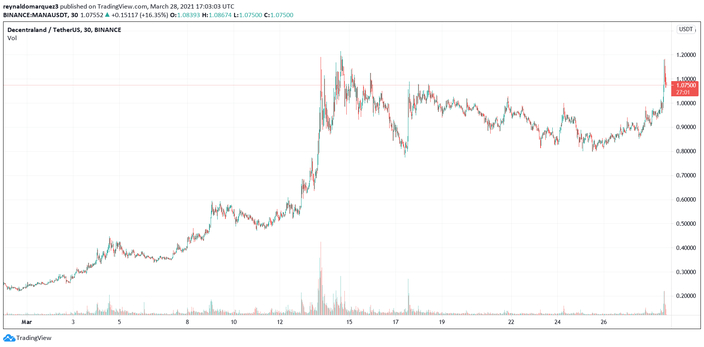
MANA Price Analysis: One-Day Chart At the time of writing, Decentraland’s (MANA) price was $0.56, but it has since fallen back to the $0.50 price zone. After dropping below the crucial support zone of $0.62 to $0.60, MANA continued to decline.Currently, the local support level for MANA is at $0.51, and if the broader market keeps moving downward, MANA could fall to $0.47.
The overhead resistance for the coin is at $0.58, and if it surpasses this level, it could reach $0.60. The recent decrease in MANA trading volume suggests an increase in selling pressure.
Technical AnalysisThe coin buyers attempted to recover, but the bears continued to pull the altcoin down at the time of writing. The Relative Strength Index was below the half-line, signifying a rise in selling strength for the coin.
Correspondingly, a fall in demand drove the price below the 20-Simple Moving Average line, indicating that sellers were driving the price momentum in the market.
Other technical indicators have also indicated a fading bullish trend on the daily chart. The Moving Average Convergence Divergence (MACD) indicates the price momentum and potential reversal.
While the indicator continued to form green histograms, they were declining in size, reflecting a decrease in buyers.
The Directional Movement Index (DMI) displays the price direction of the altcoin, and at the time of writing, the -DI line (orange) was above the +DI line (blue), indicating a negative trend. The Average Directional Index (ADX) was below the 20-mark, indicating a weakening price trend.
origin »Bitcoin price in Telegram @btc_price_every_hour
Decentraland (MANA) на Currencies.ru
|
|