Current Bitcoin Price Action Closely Follows Textbook Distribution Pattern

Current Bitcoin Price Action Closely Follows Textbook Distribution Pattern
фото показано с : newsbtc.com

2020-8-30 22:00

Bitcoin bulls are currently attempting to turn weekly resistance at $11,500 into support. However, failure may be likely according to an ominous pattern the cryptocurrency is painting. Recent price action in the first-ever cryptocurrency closely mimics that of a Wyckoff distribution model.

If that’s what’s playing out in the crypto market, Bitcoin could take a dive to lower levels in the weeks ahead. But there also could be a fractal forming that says otherwise and suggests another move higher. Which is it?

Bitcoin Price Action Closely Resembles Wyckoff Distribution Schematic

The leading cryptocurrency by market cap is trading at roughly $11,500. Bulls are pushing hard to take Bitcoin above the key level for tomorrow night’s weekly close.

A current close at this level would mark two consecutive weeks of red candles, but could also be a confirmation of resistance turned support.

Related Reading | Why Whiskey Becoming “Liquid Gold” Highlights Bitcoin’s True Value

Bulls flipping the key weekly resistance level to support and holding would send a clear message to the market that higher prices are ahead.

Losing the level could be disastrous, however.

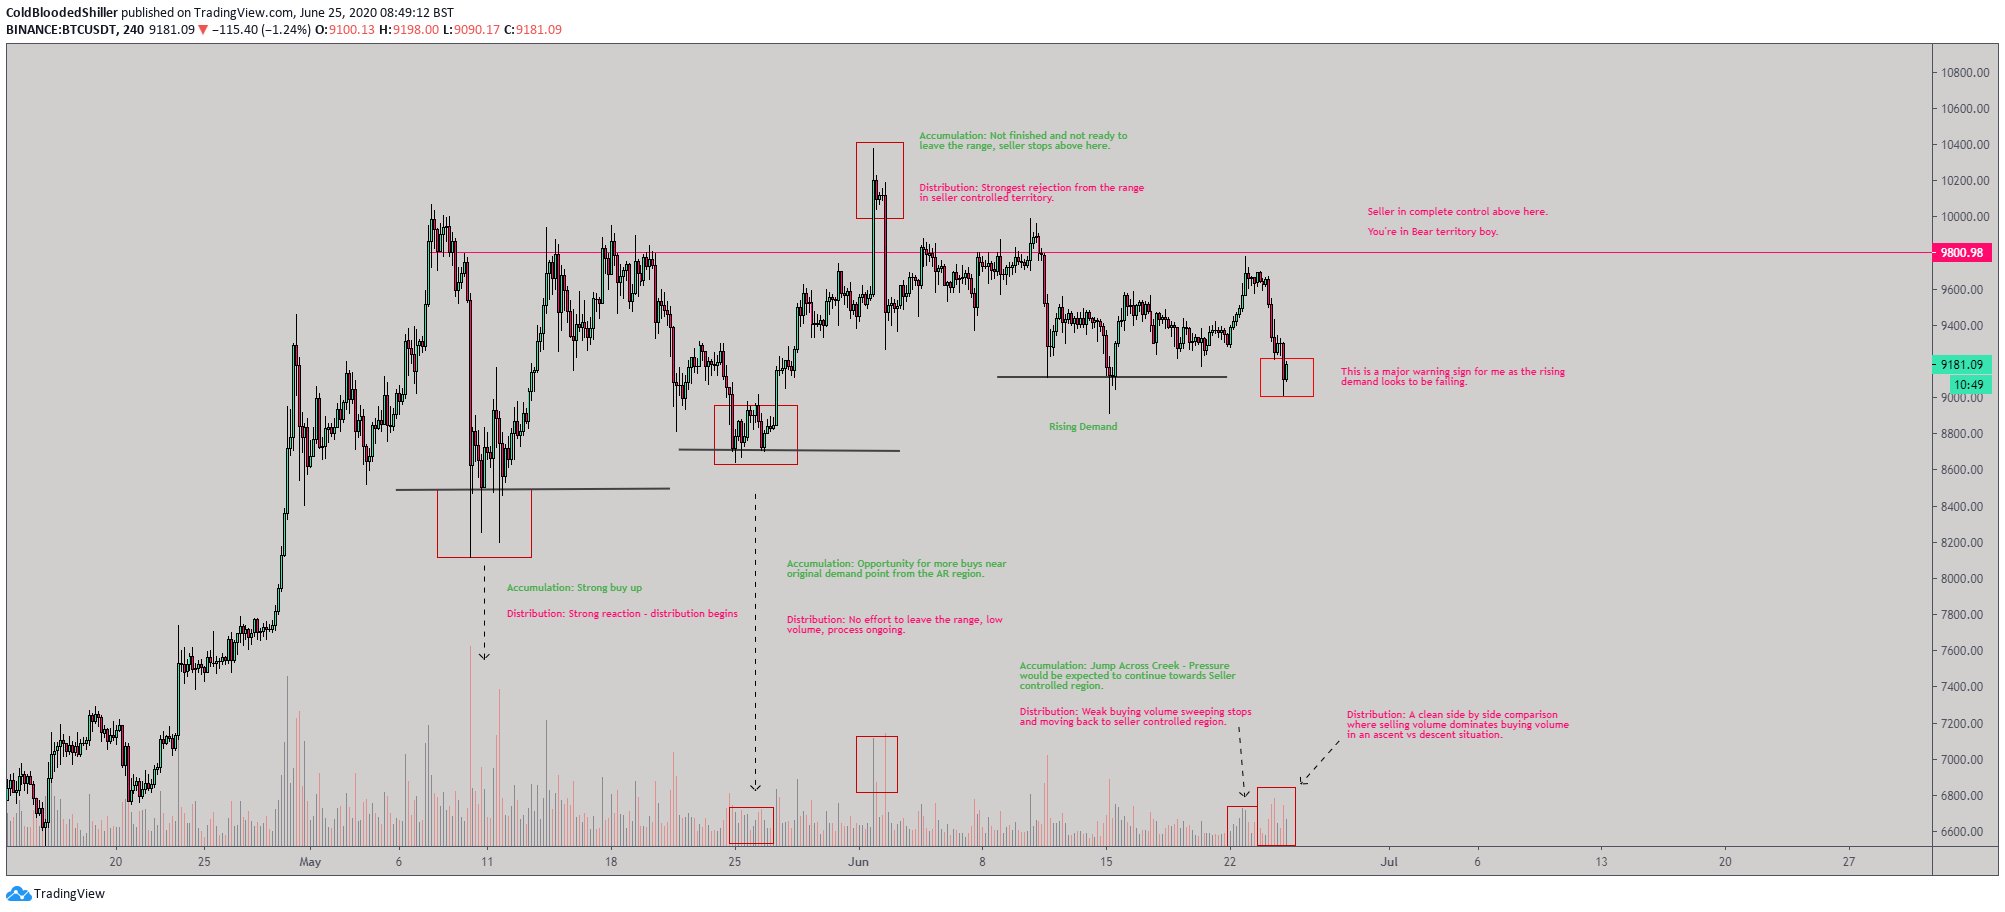
A failure to move higher here would very closely match one type of Wyckoff distribution pattern.

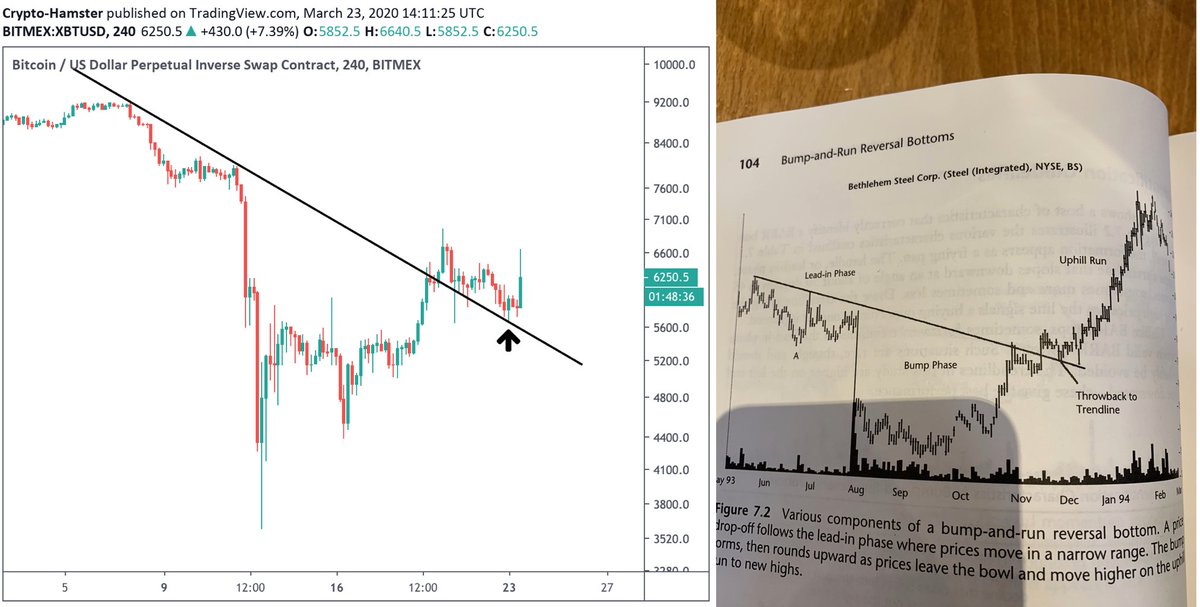
BTCUSD Wyckoff Distribution Schematic Comparison | Source: TradingView Why Even This Textbook Pattern Could Be Fakeout Before A Move Higher

The chart above shows the uncanny resemblance. The distribution phase is characterized by a buying climax, followed by a sign of weakness then numerous failed “upthrusts”.

The first touch of $12,000 would have acted as the buying climax, while the second touch was the first failed upthrust. The push to and rejection from the $12,400 high may have been an “upthrust after distribution.”

To finish the schematic, the current price action resembles the “last point of supply” before tanking.

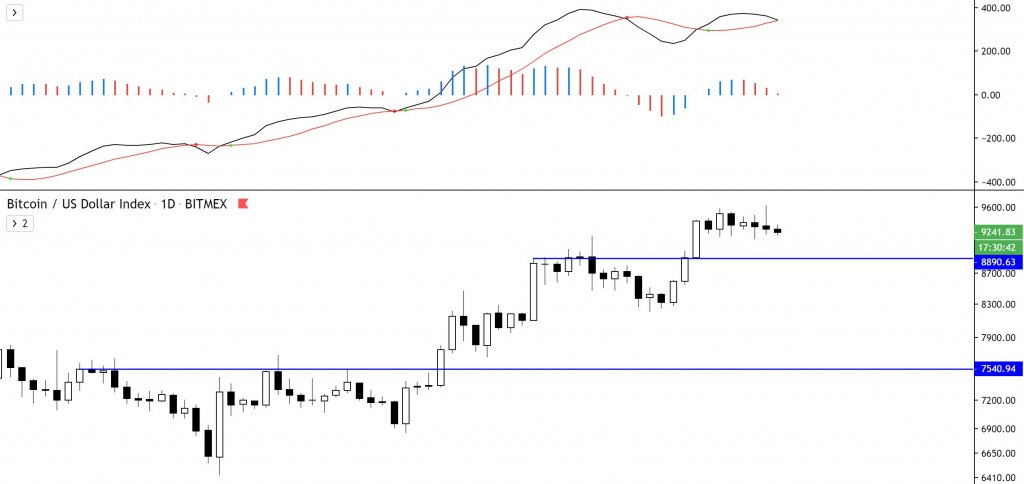
The only problem with this theory, despite it’s proven effectiveness, is due to Bitcoin price following a very similar path just ahead of the break through $10,000.

Related Reading | This Unique Perspective Makes It Clear Bitcoin Cycles Are Lengthening

Rather than falling following the completion of what closely matches a Wyckoff distribution schematic, the leading cryptocurrency surged higher to the current range.

BTCUSD Wyckoff Distribution Pattern Fakeout Fractal | Source: TradingView

Could the distribution pattern have been a fakeout before the move higher, and history will soon repeat? Or is this the pattern too textbook and will result in downside ahead?

This weekend’s weekly close could determine the crypto market’s fate for some time. A close above $11,500 likely signals more continuation, while a close below could put an end to the rally.

origin »

Bitcoin price in Telegram @btc_price_every_hour

Global Cryptocurrency (GCC) на Currencies.ru

$ 0 (+0.00%)
Объем 24H $0
Изменеия 24h: 0.00 %, 7d: 0.00 %
Cегодня L: $0 - H: $0
Капитализация $0 Rank 99999
Цена в час новости $ 0.0024073 (-100%)

cryptocurrency pattern distribution price closely bitcoin action

cryptocurrency pattern → Результатов: 126


Фото:

This Alarming Pattern Suggests Bitcoin Could Soon Crater Lower

As Bitcoin continues its range-bound trading phase, traders are placing their bets on which direction it will trend next This consolidation has caused the cryptocurrency’s volatility to plunge to lows not seen in over a year It is unlikely that this trend will last for too much longer, as extended bouts of sideways trading are typically followed by massive movements One technical pattern that is strikingly similar to that seen in 2019 is now suggesting […]

2020-7-4 02:00


Фото:

Bitcoin Avoids Forming a Death Cross; Instead Confirms Bullish Triangle Pattern

Bitcoin’s sharp decline seen yesterday put it in peril of losing its macro technical strength and seeing even further downside The cryptocurrency has been able to largely invalidate this weakness, as it is now pushing up towards its previous consolidation channel Its strong reaction to its recent lows allowed it to narrowly avoid forming a so-called “death cross” on its cloud indicator It also confirmed the existence of a bull-favoring ascending triangle that could fuel […]

2020-6-17 02:00


Фото:

Bitcoin Will Confirm a Massive Bearish Distribution Pattern if it Breaks $8,600

Bitcoin’s long-held consolidation phase came to an end yesterday evening when sellers pushed the benchmark cryptocurrency below $9,000 Although buyers stepped up and quickly defended against further losses, they have been unable to catalyze any type of sharp recovery It now appears that BTC is well positioned to see a notable decline in the days ahead as sellers target the key support at $8,600 If this level is broken below, a massive distribution pattern will […]

2020-6-16 21:00


Фото:

Analysts Target a Sub-$200 Move for Ethereum Once it Taps This Crucial Level

Ethereum has been closely tracking Bitcoin’s price action throughout the past several weeks and months The cryptocurrency did recently form an incredibly bearish technical pattern that analysts are still closely watching There’s a strong possibility that the crypto could be positioned to see notable downside in the near-term due to this pattern One analyst is even targeting a movement down to the sub-$200 region This price action could be magnified by a recent surge in […]

2020-6-15 22:00


Фото:

This Fractal Pattern Puts XRP at Grave Risk of Seeing Massive Downside

XRP has been largely hovering around the $0.20 region in recent times, failing to garner any decisive momentum as the aggregated market stalls The crypto’s lack of growth in recent times has led it to surrender its spot as the third largest digital asset to stablecoin Tether (USDT) One analyst is now pointing to a grim fractal pattern that shows the cryptocurrency could be at grave risk of seeing a massive downside movement in the […]

2020-5-22 23:00


Фото:

This Technical Pattern Signals Bitcoin Could Soon See an Explosive 160% Rally

Bitcoin has entered what appears to be consolidation phase as it struggles to firmly surmount the $9,000 region The cryptocurrency is flashing some hints of bullishness as it attempts to gain a foothold within this region, although bulls need to garner greater buying pressure to make this happen One factor that could bolster Bitcoin and send it screaming back up towards its all-time highs is an extremely bullish technical pattern that just emerged Bitcoin has […]

2020-5-12 21:00


Analyst: Downside may be imminent for Chainlink and Tezos, April’s top crypto trades

Prior to late last week’s rally to $7,800, Bitcoin was stuck in a consolidation pattern for weeks on end, trading in a 10 percent range for what was literally weeks. During that time, two altcoins managed to break the mold, rallying as the rest of the cryptocurrency market stagnated: Tezos (XTZ) and Chainlink (LINK), the […] The post Analyst: Downside may be imminent for Chainlink and Tezos, April’s top crypto trades appeared first on CryptoSlate.

2020-4-29 04:30


Фото:

Analyst: this pattern shows Bitcoin could be bound for a massive July breakout

The past couple of days have been rocky for Bitcoin (BTC), with the benchmark cryptocurrency facing some notable downwards pressure in the time following its recent rejection at $9,600. It is important to note that the rejection at this level – although bearish over the short-term – may actually throw Bitcoin into a highly bullish […] The post Analyst: this pattern shows Bitcoin could be bound for a massive July breakout appeared first on CryptoSlate.

2020-2-5 06:00