2021-1-26 14:25 |
Chainlink (LINK) reached an all-time high price on Jan. 25 but has fallen back slightly since.
Technical indicators are still bullish and suggest that Chainlink is expected to continue increasing to reach even higher.
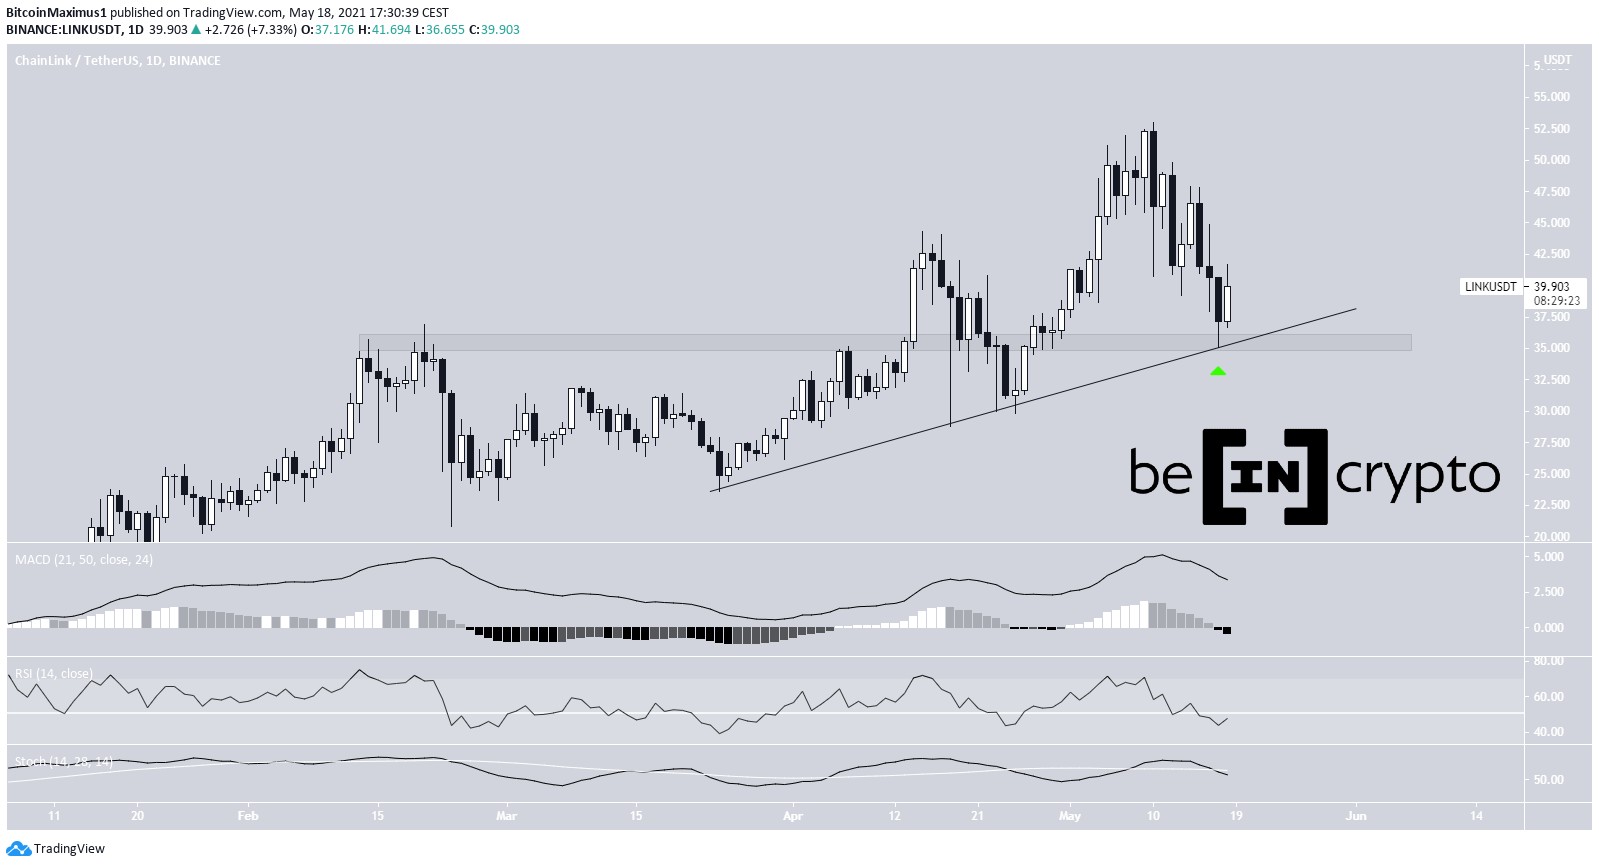
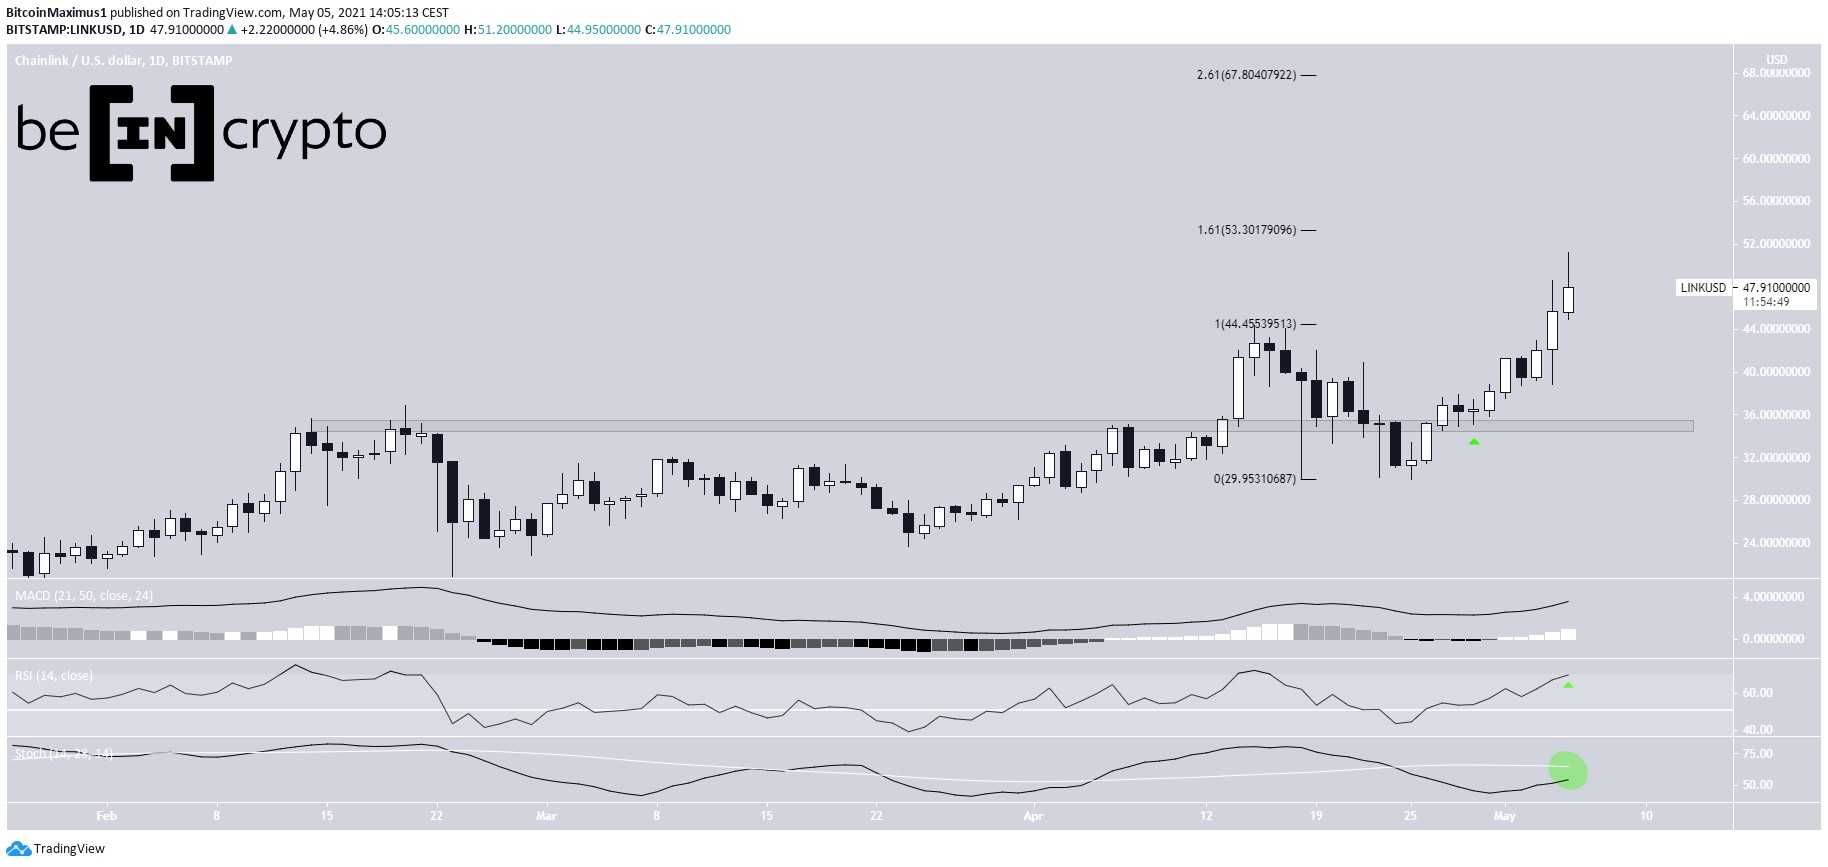
Chainlink All-Time High PriceOn Jan. 15, 2021, LINK broke out above the previous all-time high. It returned to validate the level as support and proceeded to increase towards the current all-time high price of $25.78 reached on Jan. 25.
The re-test of the breakout area left a long lower wick — a sign of buying pressure. It also validated the $20 area as support.
Despite a considerable bearish divergence in the weekly RSI, technical indicators are still bullish.
The RSI has just crossed above 70, the MACD is increasing, and the Stochastic oscillator has made a bullish cross.
LINK Chart By TradingViewThe daily chart helps to isolate the support area near $20 since that is the level which it initially re-tested. Chainlink went on to deviate below this level but managed to reclaim it.
Similar to the weekly time-frame, technical indicators are bullish despite a bearish divergence in the RSI. If LINK were to drop in the short-term and generate a hidden bullish divergence, it would likely confirm the trend continuation.
Nevertheless, as long as LINK does not close on the daily below $20, it’s likely that the trend is bullish.
LINK Chart By TradingView Wave CountCryptocurrency trader @TheEWguy outlined a LINK chart, stating that it’s likely to decrease in the short-term before beginning another significant upward movement.
Source: TwitterThe most likely wave count suggests that LINK is in wave five of a long-term bullish impulse that began in January 2019 (shown in white below)
The most likely target for the move to end would be found between $27.73-$27.85. This range is the 1.61 external Fib retracement of wave 4 and the projection of the length of waves 1-3 to the bottom of wave 4.
LINK Chart By TradingView LINK/BTCThe LINK/BTC chart shows a breakout from a descending resistance line that had previously been in place since August 2020.
LINK has been moving upwards since breaking out and has nearly reached the 0.382 Fib retracement level found at 86,000 satoshis. The level is likely to provide some resistance, at least in the short-term.
Technical indicators are bullish, suggesting that LINK is likely to resume its upward movement.
Nevertheless, we cannot consider the trend bullish until LINK manages to reclaim the 100,000 satoshi resistance area.
LINK Chart By TradingView ConclusionBoth the LINK/USD and LINK/BTC pairs are expected to continue moving higher despite the possibility of a short-term rejection.
For BeInCrypto’s latest Bitcoin (BTC) analysis, click here!
The post Chainlink (LINK) Pumps to New All-Time High in a Bullish Resurgence appeared first on BeInCrypto.
origin »Bitcoin price in Telegram @btc_price_every_hour
High Voltage (HVCO) на Currencies.ru
|
|


