2021-6-8 15:00 |
Cardano (ADA) has been decreasing since May 16 but is still trading above its previous 2018 all-time high level.
It’s likely that the token revisits the long-term ascending support line and potentially the $1.05 area once more.
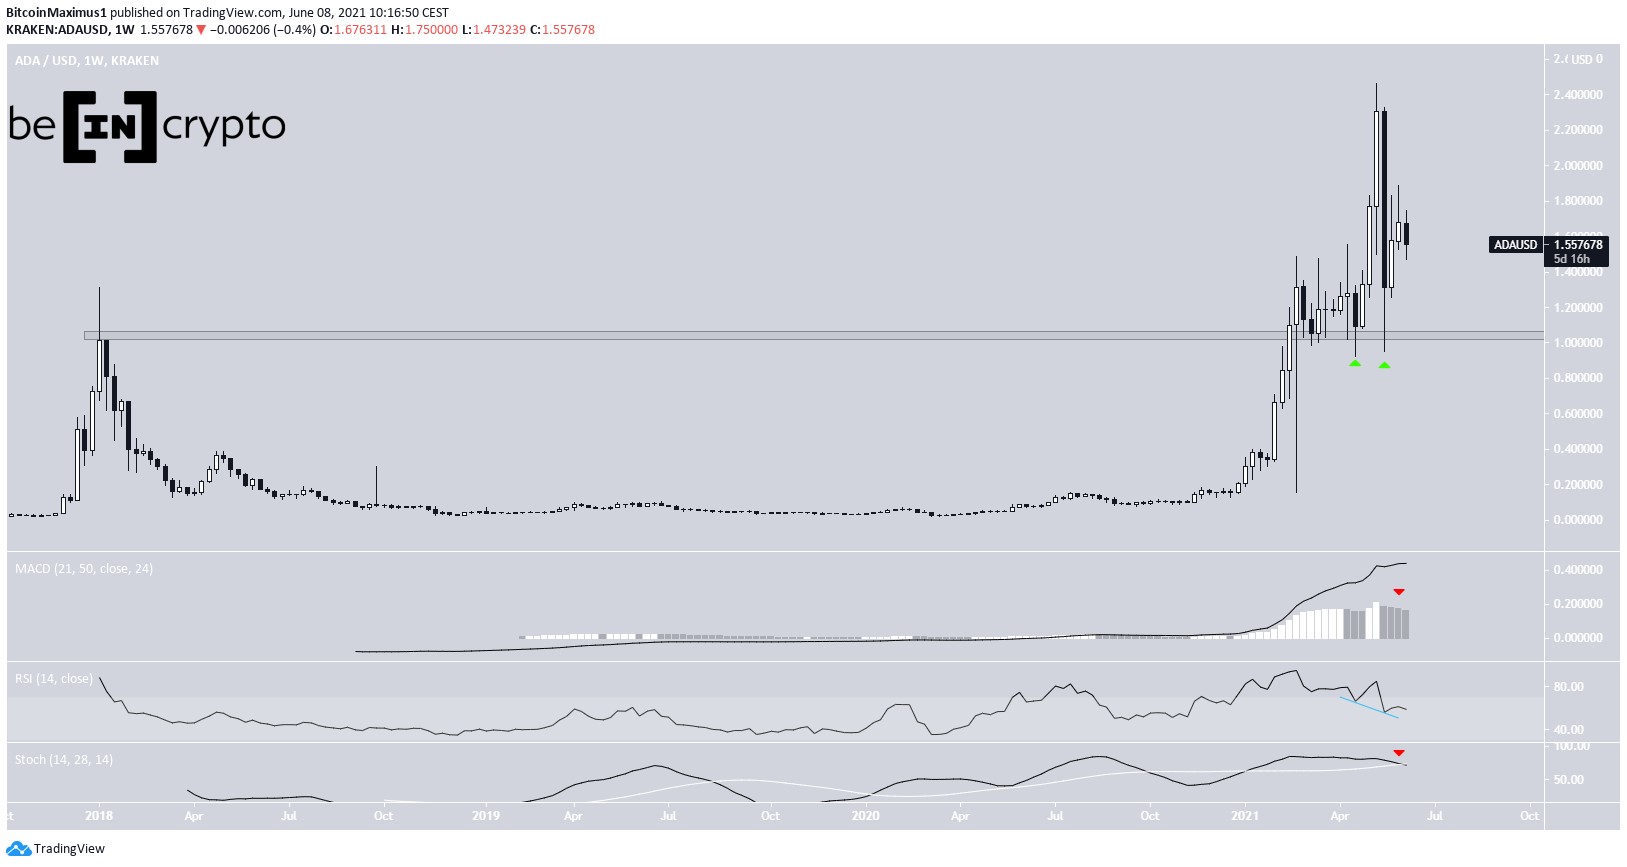
Long-term Cardano movementCardano has been falling since May 16, when it reached an all-time high price of $2.46.
However, the decrease served to validate the previous all-time high resistance area of $1.05 as support (green icons).
As long as ADA is trading above this level, the trend can be considered bullish.
Technical indicators are providing mixed signs. The MACD is still positive but has lost strength, the RSI is decreasing but has generated a hidden bullish divergence, and the Stochastic oscillator has made a bearish cross (red icon).
ADA Chart By TradingView Short-term breakdownThe daily chart shows an ascending support line in place since Feb. 12. Currently, the line is near $1.20.
Unlike the weekly time frame where indicators are undecided, signals are decisively bearish in the daily time frame.
The RSI has fallen below 50, the MACD is negative, and the Stochastic oscillator has rejected a bullish cross.
Therefore, it’s likely that ADA falls toward this support line.
ADA Chart By TradingViewThe shorter-term chart shows that the token has already broken down from a short-term ascending support line.
The closest support area is found at $1.34. This is the 0.618 Fib retracement support level. This is likely to act as minor support prior to the previously outlined long-term ascending support line.
Technical indicators are bearish, indicating that ADA is likely to make the move down to this horizontal support.
ADA Chart By TradingView ADA/BTCCryptocurrency trader @TheEurosniper outlined an ADA/BTC chart, stating that an eventual new all-time high is expected due to the considerable consolidation period prior to the breakout.
Source: TwitterThe ADA/BTC chart looks more bullish than its USD counterpart. It has reclaimed the 3,800 satoshi area and validated it as support after.
While there was a bearish divergence in the RSI, it already caused the aforementioned decrease, which validated the 3,800 satoshi area as support.
Both the MACD and Stochastic oscillator are increasing, supporting the continuation of the upward movement.
The next resistance is found at 6,150 satoshis.
ADA/BTC Chart By TradingViewFor BeInCrypto’s latest bitcoin (BTC) analysis, click here.
The post Cardano (ADA) Struggles to Find Footing After Fall From Highs appeared first on BeInCrypto.
origin »Bitcoin price in Telegram @btc_price_every_hour
Cardano (ADA) на Currencies.ru


|