2020-4-4 07:15 |
Similar to the rest of the cryptocurrency market, the LINK price decreased significantly from March 11-13. The decrease had a faster rate than that of BTC, causing the LINK/BTC price to decrease considerably. This ended a long-term upward trend in the pair, which had reached an all-time high on Feb. 20.
Well-known trader @CrpytoCapo_ tweeted a chart outlining the LINK price movement, using both the BTC and USD pairs. He stated that he has a bullish outlook in all time-frames for LINK/BTC, while he is bullish only in the long-term for LINK/USD. He believes the LINK/USD trend should be considered bearish in the short/medium-term.
$LINK analysis (BTC and USD pairs)
-BTC pair is in a clear uptrend (higher highs and higher lows)
-USD pair target is $0.95
Bearish short-mid term, bullish long term. https://t.co/pUytw4IOKr pic.twitter.com/IlzLoY1SuN
— il Capo Of Crypto (@CryptoCapo_) April 2, 2020
In this article, we will take a look at both pairs and determine their potential for increases/decreases.
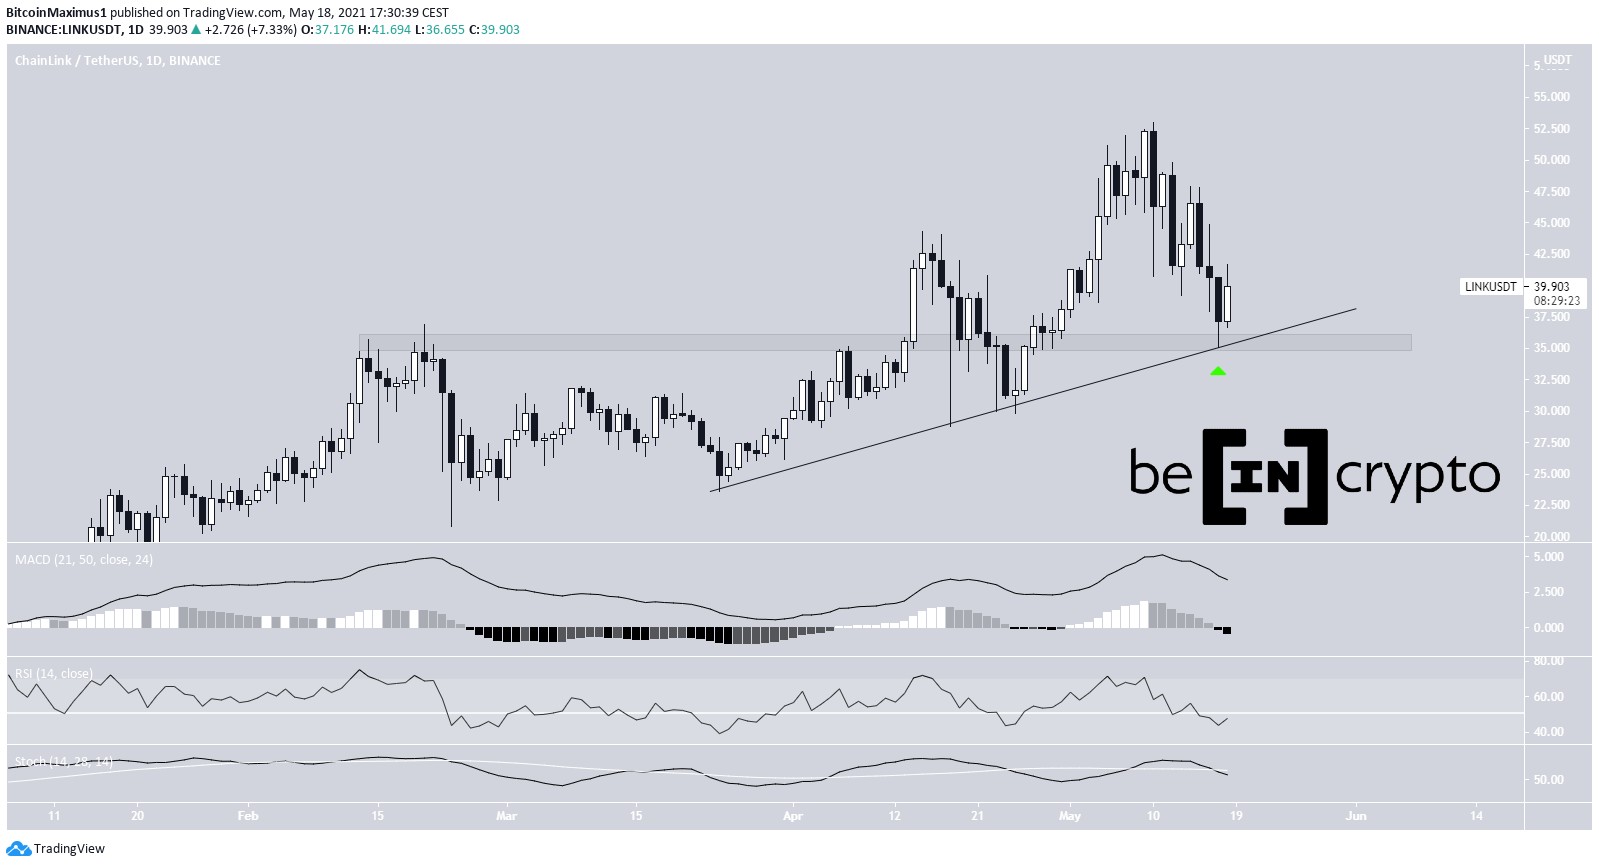
LINK/BTCThe LINK price has been following a curved ascending support line since January 2018, almost since its inception. At the time of writing, it was trading slightly below it, touching it for the fifth time. However, it has yet to reach a weekly close below it.
The most interesting area is found at 35,000 satoshis. This area acted as resistance from July 2019 until March 2020, when the price was finally able to successfully break out and reached an all-time high.
At the time of writing, the price was in danger of reaching a close below this area. If it does so, along with a decrease below the ascending support line could mean that the upward trend that lasted for more than two years has ended.
LINK Chart By Trading ViewHowever, the daily chart shows that the price has almost reached the 200-day moving average (MA), which is expected to provide support. In addition, it is trading inside a minor support area and a descending wedge, which is considered a bullish reversal pattern. Combining this with the bullish divergence in the RSI, the price is expected to break out and move towards the next resistance area.
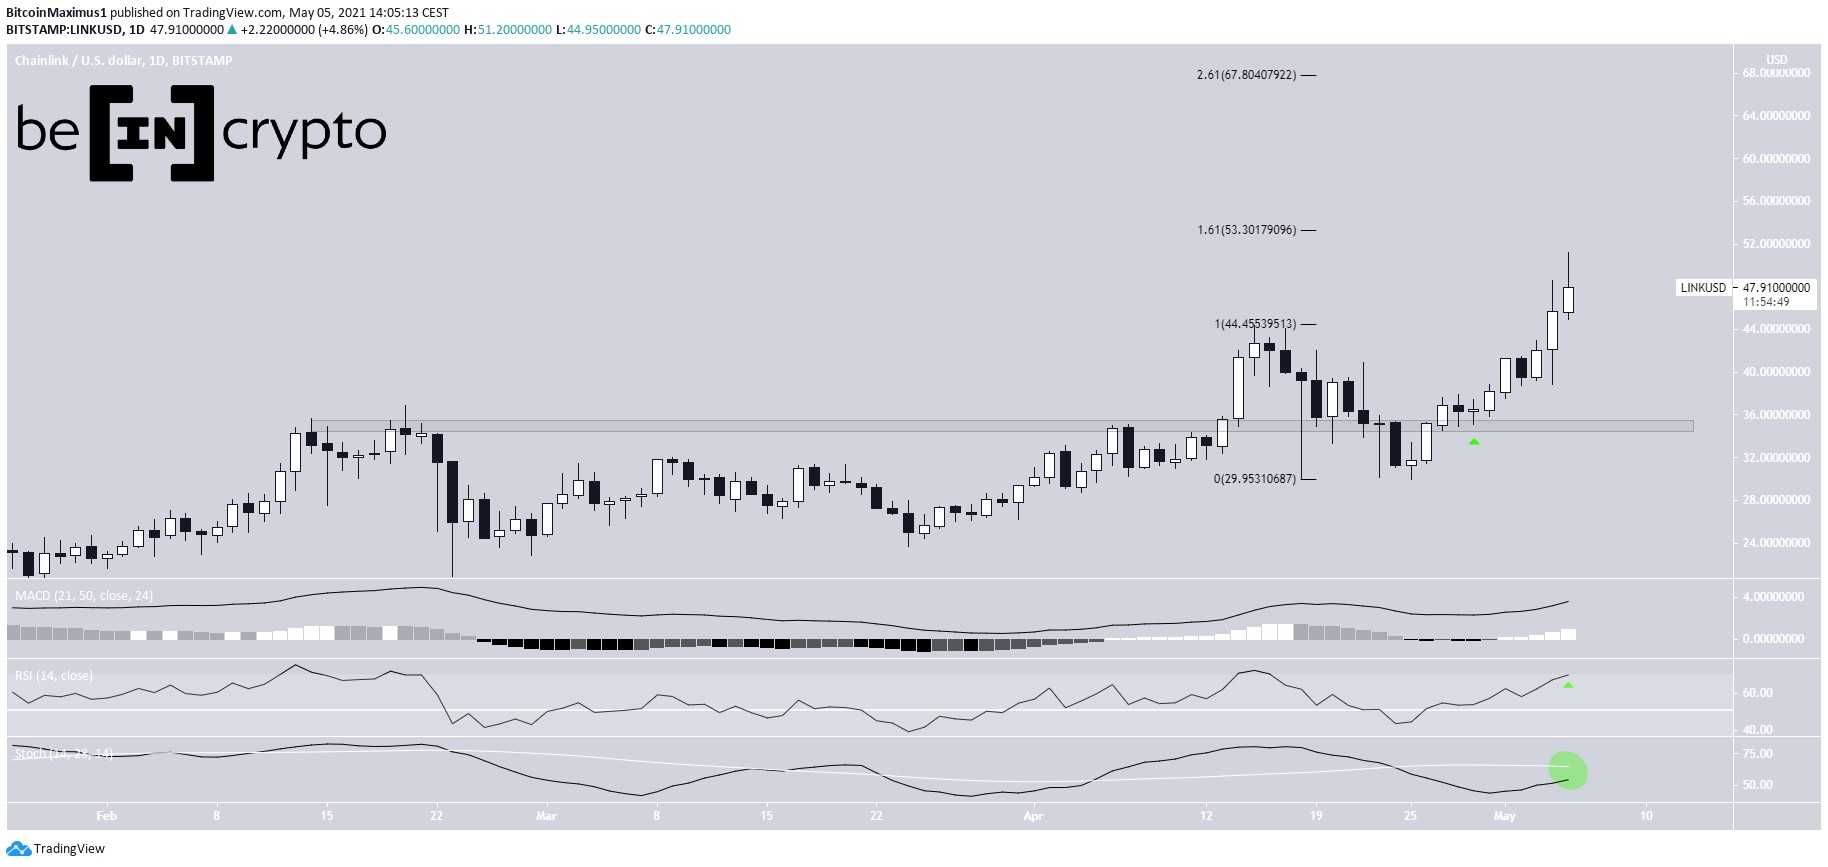
LINK Chart By Trading View LINK/USDThe LINK/USD pair shows an entirely different movement. The price reached the $1.5 support area on March 13 and began the current upward move. The price has not traded below this level since May 2019.
However, the price has yet to even move above the 0.382 fib level of the previous decrease, indicating that the current move is a retracement rather than the beginning of a new upward move.
The closest resistance area is found at $3. At the time of writing, the most likely movement would be a price decrease towards the $1.5 area, followed by a period of range trading between $1.5-3.
LINK Chart By Trading View
A breakdown below the $1.5 area would likely mean that the upward trend has ended and LINK is bearish.
The post Can the LINK Trend Still Be Considered Bullish? appeared first on BeInCrypto.
origin »Bitcoin price in Telegram @btc_price_every_hour
ChainLink (LINK) на Currencies.ru
|
|