2021-5-13 20:00 |
Bitcoin (BTC) is expected to break out above the current resistance area at $58,000.
Ethereum (ETH) reached a new all-time high price on May 12. XRP (XRP) has likely begun sub-wave five of a bullish impulse. Swipe (SXP) reached a new all-time high price on May 3.
Zcash (ZEC) has reached a long-term resistance area at $356. Band Protocol (BAND) is trading inside an ascending parallel channel. Oasis Network (ROSE) is following a descending resistance line.
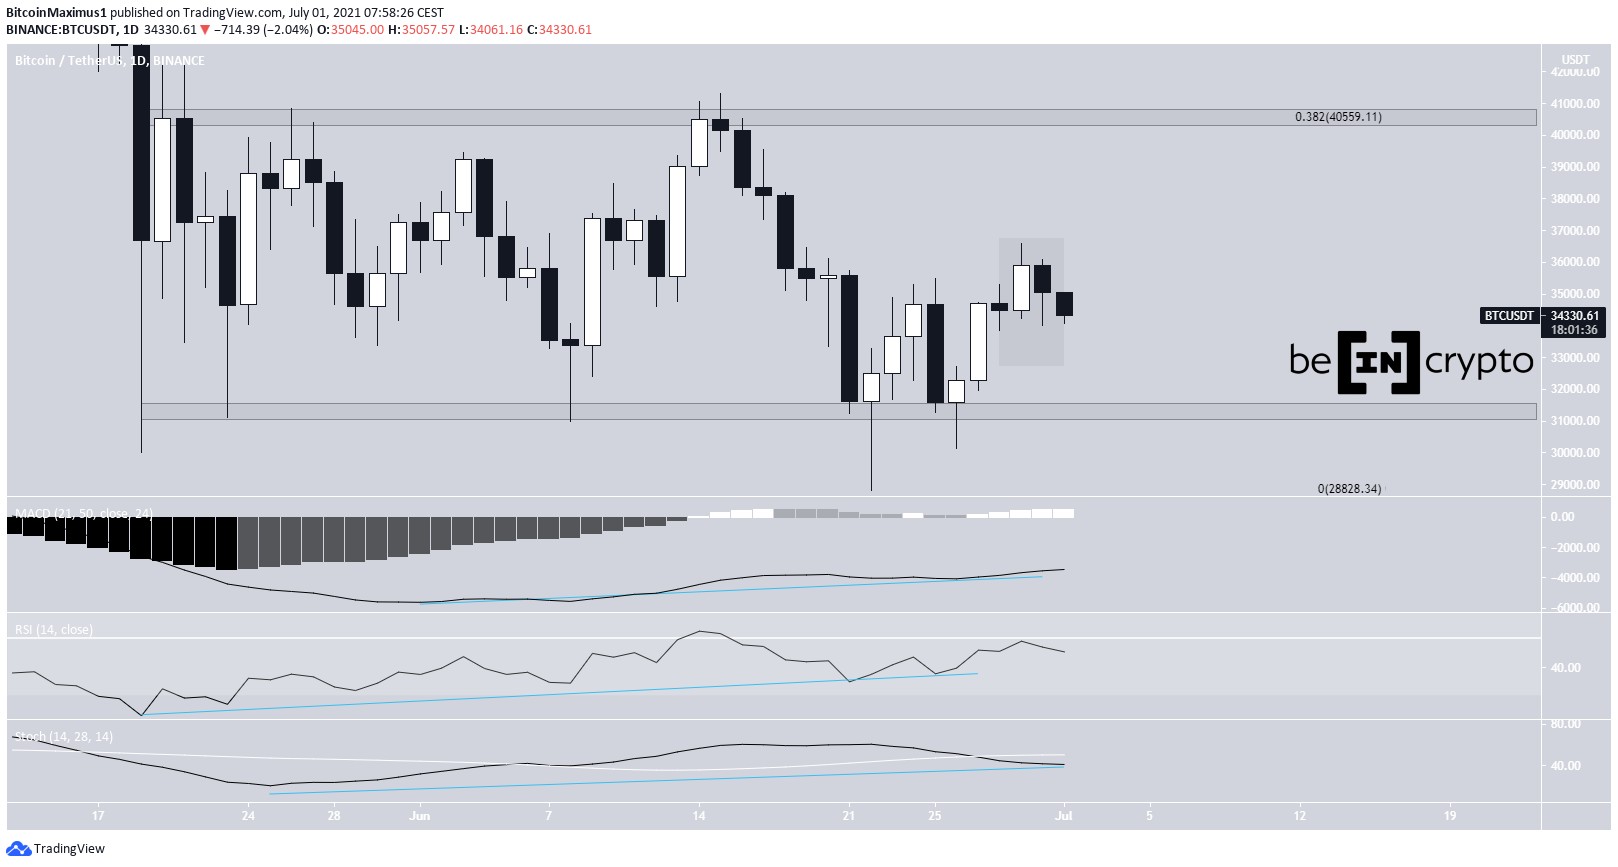
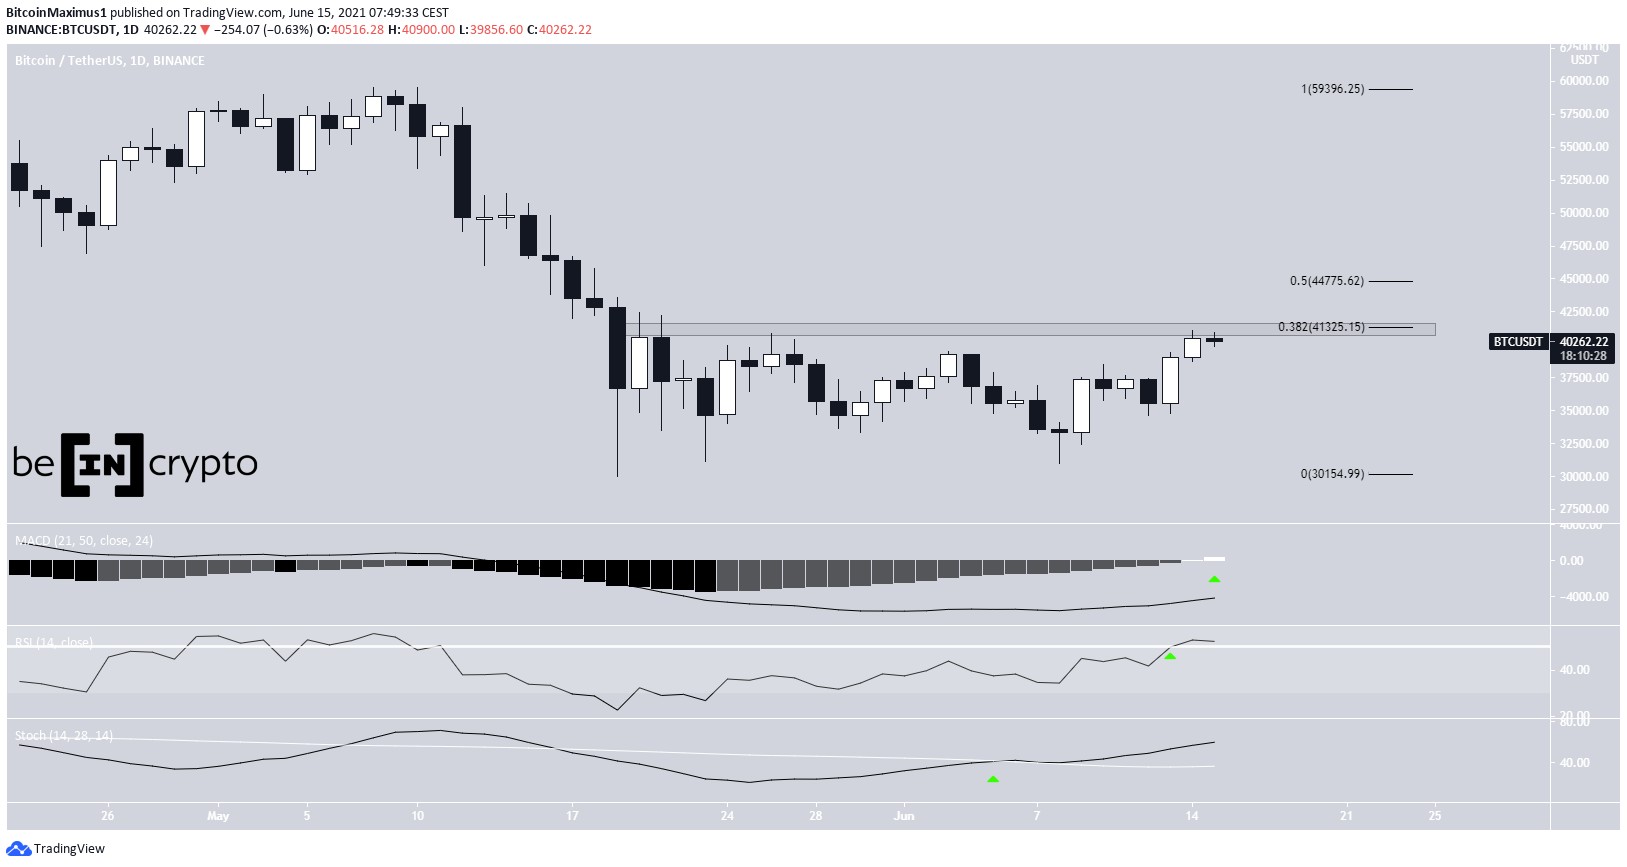
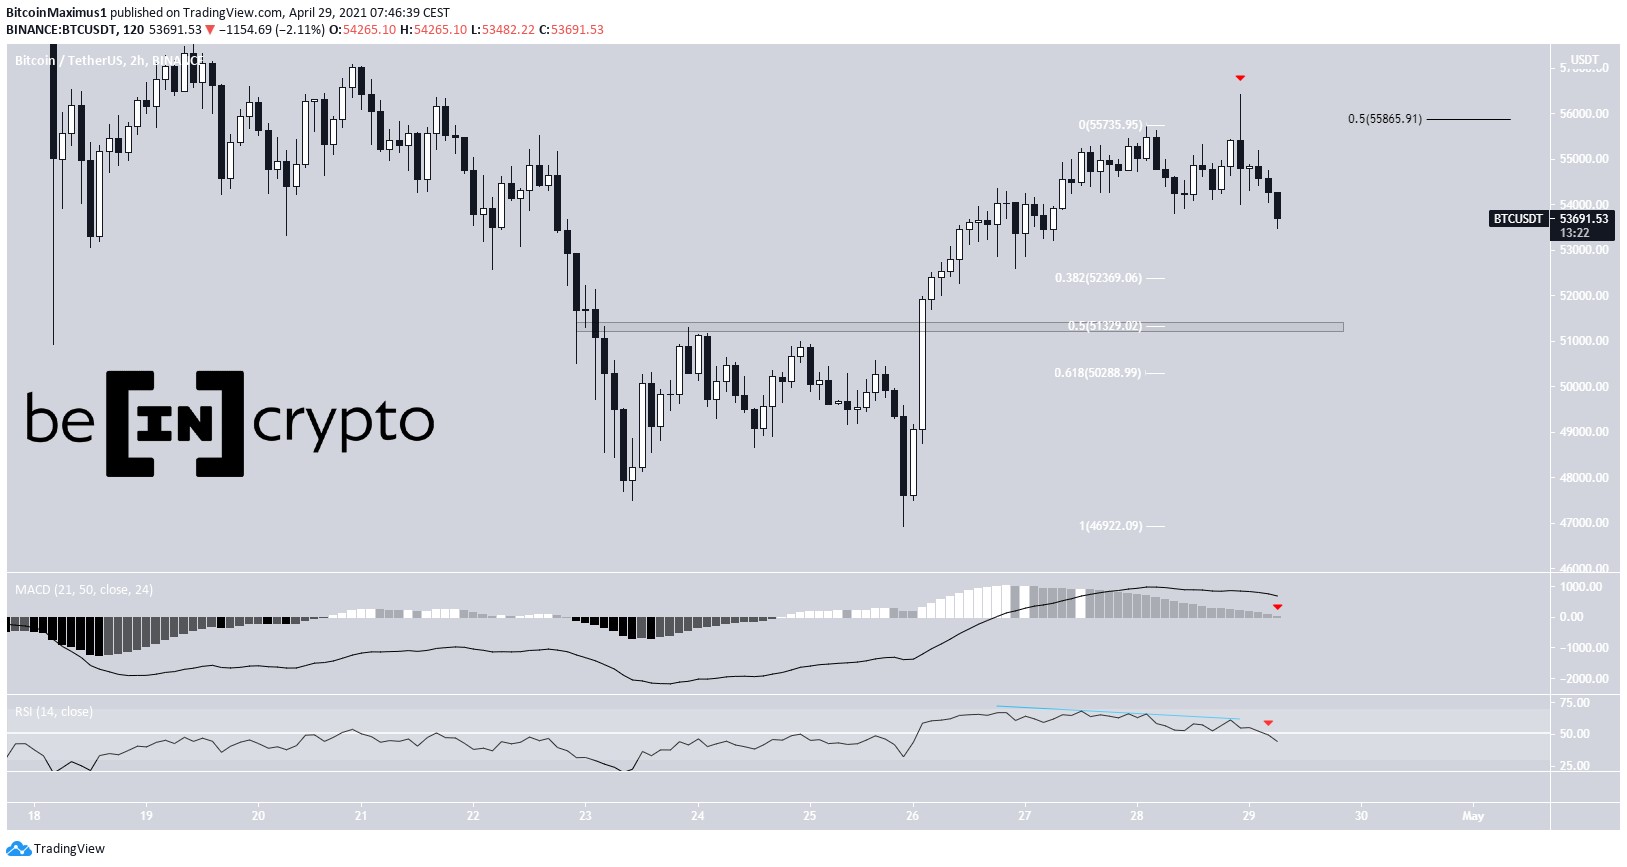
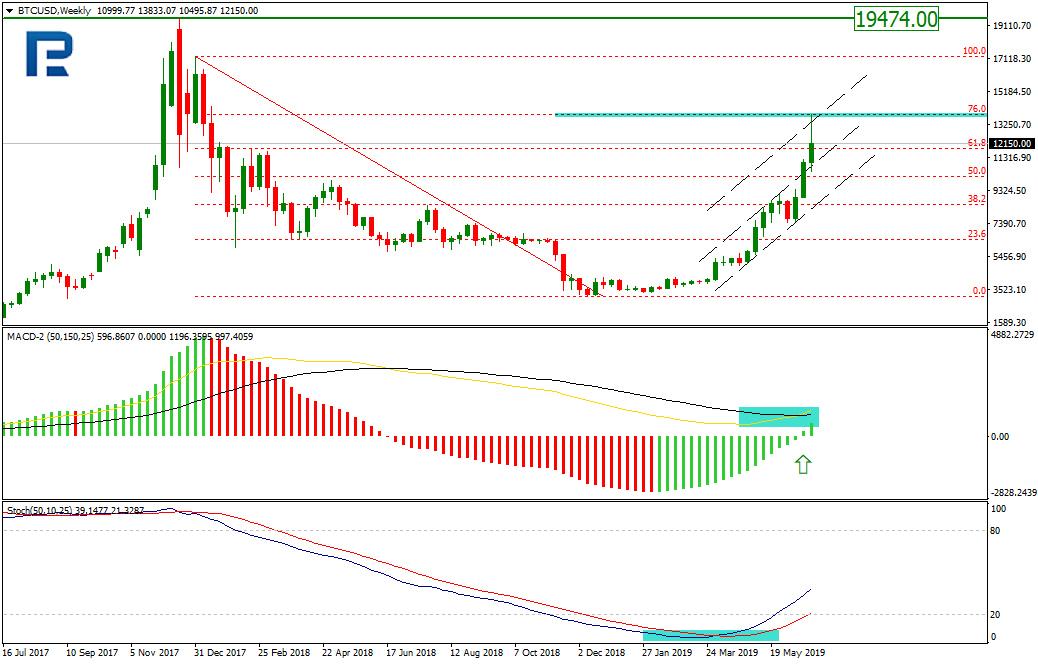
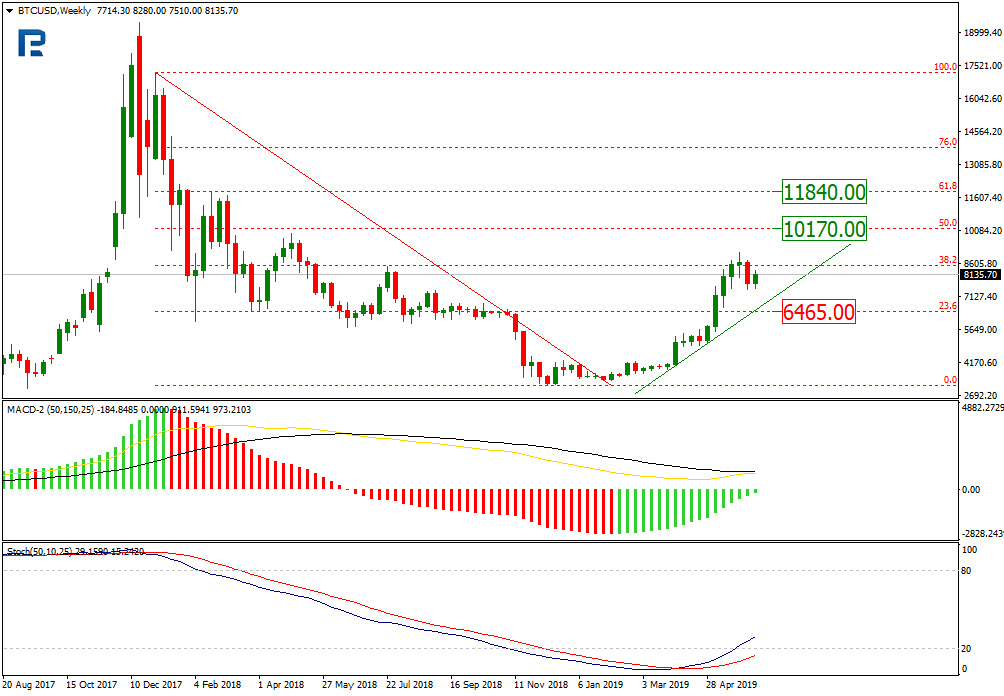
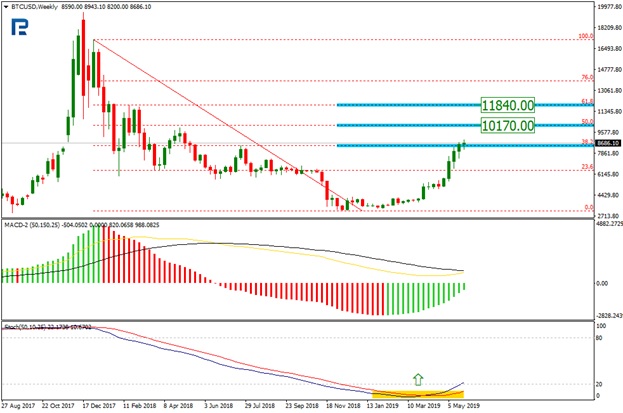
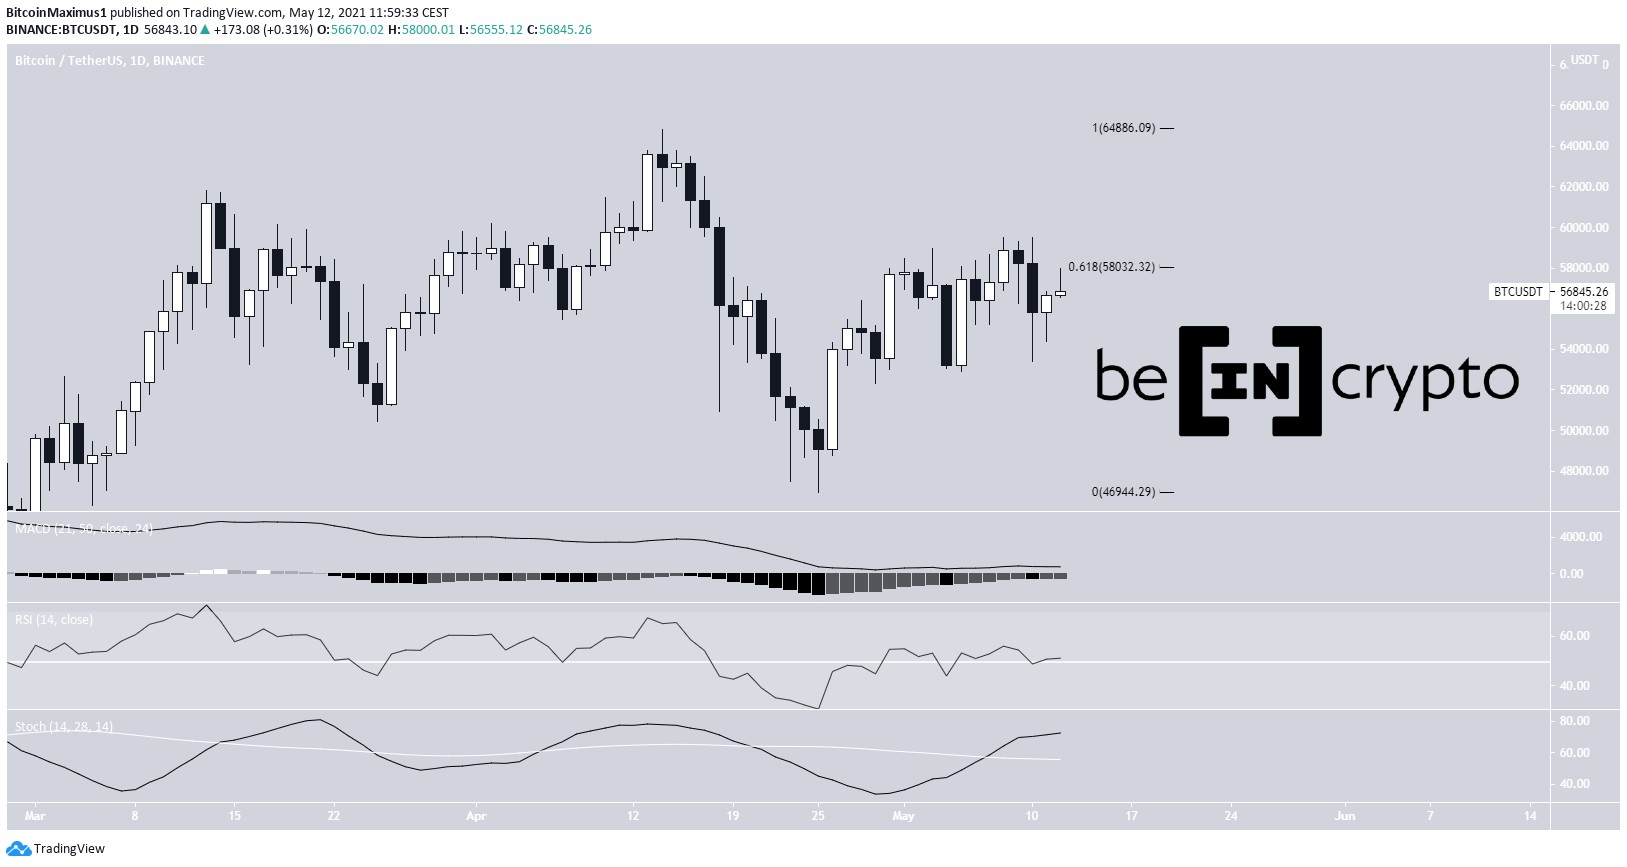
Bitcoin (BTC)BTC has been moving upwards since April 25. However, it has been struggling to move above the $58,000 resistance area over the past week. This is the 0.618 Fib retracement level of the previous downward movement.
Nevertheless, technical indicators are bullish, supporting the possibility of a continued upward movement. It is expected to continue increasing towards a new all-time high price.
Chart By TradingView Ethereum (ETH)ETH has been moving upwards at an accelerated pace since April 23, when it was trading at a low of $2,107. On May 12, it managed to reach a new all-time high price of $4,370.
The price is approaching several crucial Fib retracement levels, that are likely to act as the top of the current upward movement.
It has already moved above the $4,147 area, which is the 1.61 Fib projection of sub-waves 1-3 (orange). Therefore, the next most likely area for the top is found between $4,470 and $4,540, creating by using the same Fib projection method on waves 1-3 (white).
Chart By TradingView XRP (XRP)XRP has been moving upwards since it bounced on April 23. So far, it has managed to reach a high of $1.765 before decreasing.
Technical indicators are still bullish. The Stochastic Oscillator has made a bullish cross and the MACD is positive. In addition, there is hidden bullish divergence developing in the RSI.
Therefore, XRP is likely to increase towards the next closest resistance level at $2.70.
Chart By TradingView Swipe (SXP)On April 23, SXP began a ten-day period in which it increased significantly. It proceeded to reach a new all-time high of $5.86, doing so on May 3. The upward movement does look like the beginning of a new impulse.
While it has been moving downwards since, it managed to bounced between the 0.5 and 0.618 Fib retracement support levels at $4.27 to $3.89 (white).
Technical indicators in the daily time-frame are still bullish, supporting the continuation of the upward movement.
The next closest resistance levels are found at $7.22 and $10, respectively. They are found using an external Fib retracement on the most recent drop (black).
Chart By TradingView Zcash (ZEC)ZEC has increased considerably over the past three weeks and has just reached the $356 resistance area.
Currently, it is in the process of moving above it. If successful, the next resistance would be found at $471.
Technical indicators are bullish, supporting the possibility that the coin breaks out.
Chart By TradingView Band Protocol (BAND)BAND has been trading inside an ascending parallel channel since Feb. 13. On April 18, it bounced on the support line of this channel and has been moving upwards since. Shortly afterwards, it managed to reclaim the $15.50 area and validate it as support.
BAND is expected to move towards the resistance line of the channel and potentially break out.
Chart By TradingView Oasis Network (ROSE)ROSE has been following a descending resistance line since reaching an all-time high price on March 14.
While it has decreased significantly while following it, it is still trading above the main support level at $0.14.
Most recently, it deviated below it on April 15, before reclaiming the area. This is a bullish development that often leads to a breakout in the other direction.
Therefore, it is expected to break out and move towards the next resistance levels at $0.20 and $0.25, respectively.
Chart By TradingViewFor BeInCrypto’s latest bitcoin (BTC) analysis, click here.
The post BTC, XRP, ETH, SXP, ZEC, BAND, ROSE —Technical Analysis, May 12 appeared first on BeInCrypto.
origin »Bitcoin price in Telegram @btc_price_every_hour
Bitcoin (BTC) на Currencies.ru
|
|