2021-9-11 15:45 |
The positions of long-term Bitcoin investors have remained rock solid despite the sharp decline on 7 September. Furthermore, we continue to see a deepening supply shock as the amount of BTC on exchanges steadily decreases.
The organic growth of the Bitcoin network is illustrated by the number of addresses holding different values of BTC, most of which increased during the recent decline. The on-chain data confirms that the recent large price move was mainly triggered by overleveraged derivatives traders.
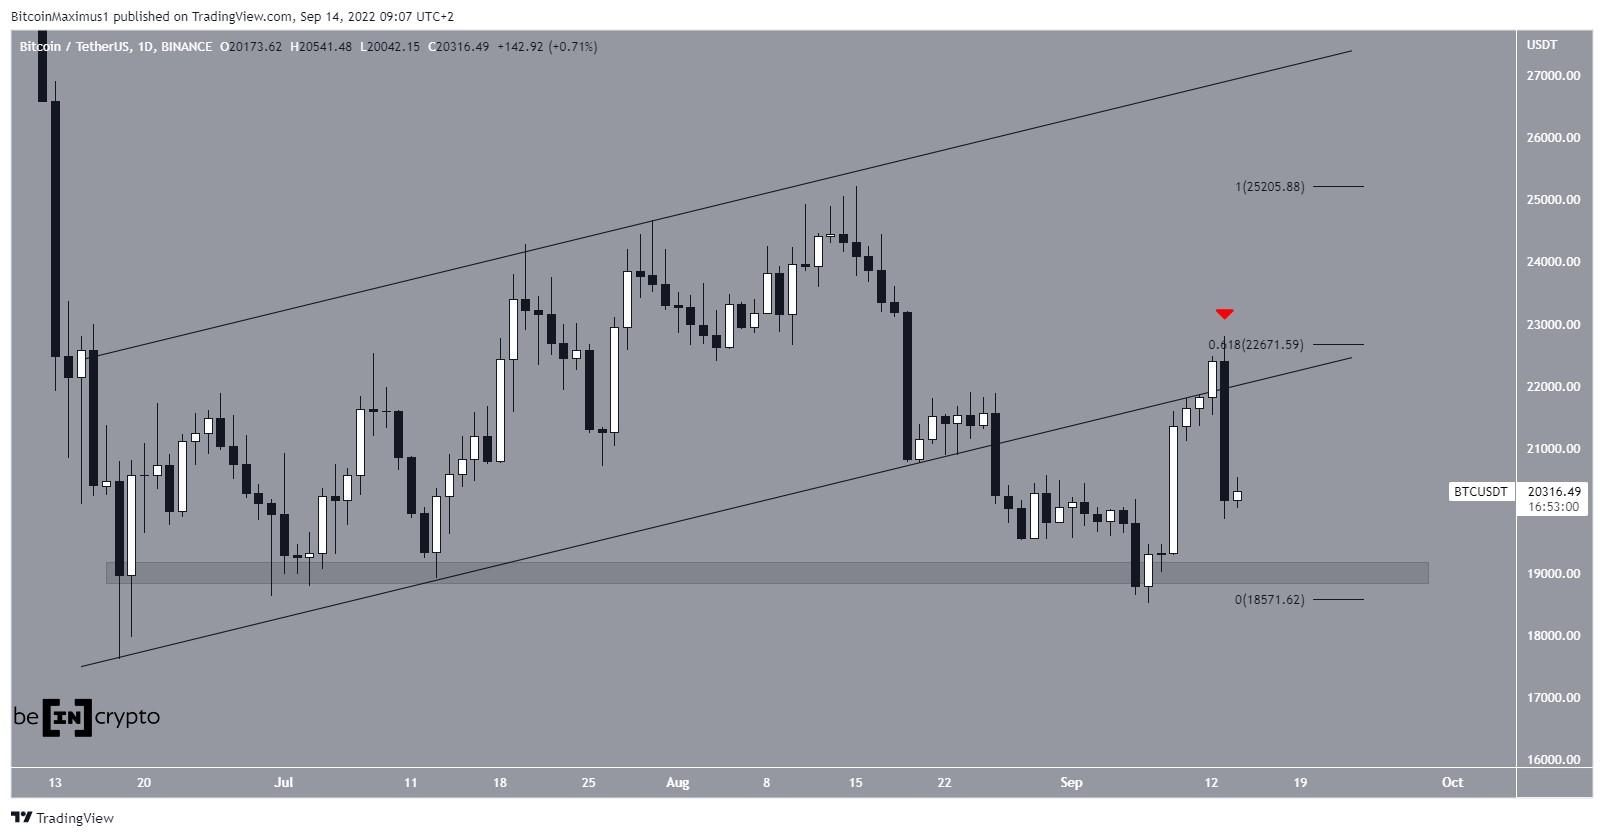
BTC price actionLast week, Bitcoin reached a local peak at $52,956 just above the 0.618 Fib retracement level on September 7. On the same day, there was a flash crash that took the BTC price to a low at $42,900. One of the reasons for the 19% decline was the clearing of long leveraged positions, which experienced liquidations totaling $4 billion.
BTC chart by TradingviewShortly after the sharp decline, the price rebounded and is currently trying to recover around $46,000. Despite the short-term rebound, technical indicators on higher intervals are starting to give bearish readings.
However, it is worth noting that the decline has served to validate the long-term area at the 0.382 Fib retracement as support. This area coincides with horizontal support levels and Bitcoin’s historic all-time high of January 8, 2021.
Investors buy during the crashOn-chain analytics data can help explain how investors behaved during the sharp decline. It turns out that many investors holding actual BTC did not show significant movements during the flash crash.
This was pointed out by on-chain analyst @woonomic, who said in a tweet that “leverage markets sold off but investor buying just got stronger”. Furthermore, he compared the recent fall to the crash caused by the COVID-19 crisis in March 2020. Woo stated:
“BTC flash crashes are caused by deleveraging, the COVID crash was similar in that derivatives overreacted, but back then it was supported by investors. This one was completely divergent and a mystery.”
This is supported by the on-chain analyst’s accompanying chart, which shows an intensifying supply shock on multiple levels: stock market outflows and short- and long-term investor positions. Woo concludes that the effect of the decline is merely “cheap coins”.
Source: Twitter Bitcoin continues to drain from exchangesWilly Woo’s observations are confirmed by another on-chain analyst @TXMCtrades, who points to the 14-day Illiquid Supply Market Gradient indicator. It is used to estimate when long-term investors with strong hands are holding their positions more tightly than the price action indicates.
According to the analyst, “long-term investors were unshaken by the drop and actually increased their holdings”. This is confirmed by the divergence between the increase in investor positions and the drop in the BTC price and by the two orange bars at the bottom of the chart below.
Source: TwitterAn additional argument was provided yesterday by @WClementeIII, who also pointed out the intensifying supply shock on Bitcoin. The on-chain analyst encourages people to “ignore the noise” and focus on the upward macro trend triggered by the diminishing number of available BTC coins.
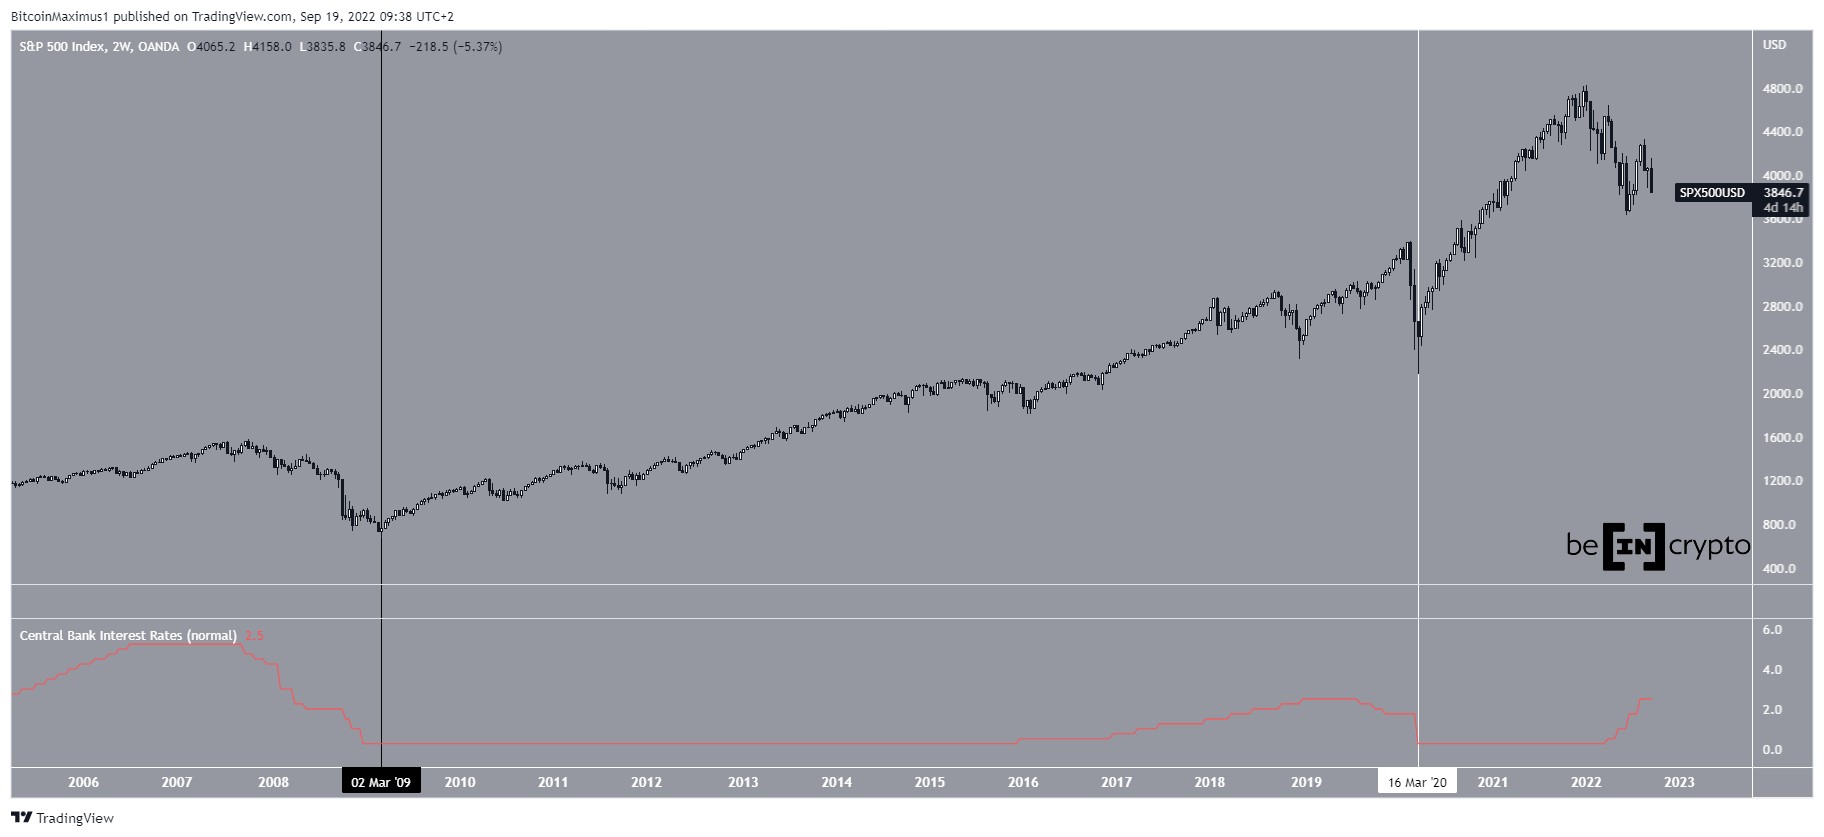
Source: TwitterThe long-term outlook highlighted by all three of the aforementioned analysts is very much evident in the chart of the balance of Bitcoin held on cryptocurrency exchanges. It turns out that the amount of BTC on exchanges has been steadily declining since the COVID-19 crisis (red circle).
BTC balance on exchanges by GlassnodeThe only two significant increases in coins on exchanges in this period were seen during the rises in the price of BTC in July 2020 and especially during the recent falls in May 2021. Furthermore, the amount of BTC available on exchanges has just reached a 3-year low. The last time exchanges recorded such low supply was in late August 2018 (green circle), with Bitcoin trading at around $7,000.
Small positions are growingThe last indicator worth noting in perspective of the recent decline is the number of addresses that hold different amounts of BTC. In the first group, there are 3 types of addresses with small amounts in the 0.01-1 BTC range.
Here we see a clear continuation of the upward movement (green rectangles) despite the drop in the Bitcoin price a few days ago (red rectangle). The number of small positions has been increasing since at least the middle of the May-July 2021 consolidation (orange arrow). The recent flash crash has only reinforced this trend.
BTC addresses chart by GlassnodeWe see more diverse behaviour in the second group of addresses, which collects positions with amounts between 10 and 10,000 BTC (grey rectangle). Increases were seen in addresses with more than 10 BTC and more than 10,000 BTC. Declines are seen in addresses with more than 100 BTC and more than 1,000 BTC. Moreover, since the consolidation of May-July 2021, the trend in the number of large addresses remains horizontal (orange arrow).
BTC addresses chart by GlassnodeFinally, it is worth noting that regardless of the amount of BTC held, the general trend in the number of addresses is not downward. This indicates the strong organic growth of the Bitcoin network and, through the continuous increase in the number of small addresses, the increasing distribution of coins.
For BeInCrypto’s latest Bitcoin (BTC) analysis, click here.
The post BTC On-Chain Analysis: Investors Buy Dip as Supply Shock Intensifies appeared first on BeInCrypto.
origin »Bitcoin price in Telegram @btc_price_every_hour
Supply Shock (M1) на Currencies.ru
|
|