2021-4-25 18:40 |
In this article, we will take a look at the three price corrections for Bitcoin (BTC) in 2021 and compare them to the current one.
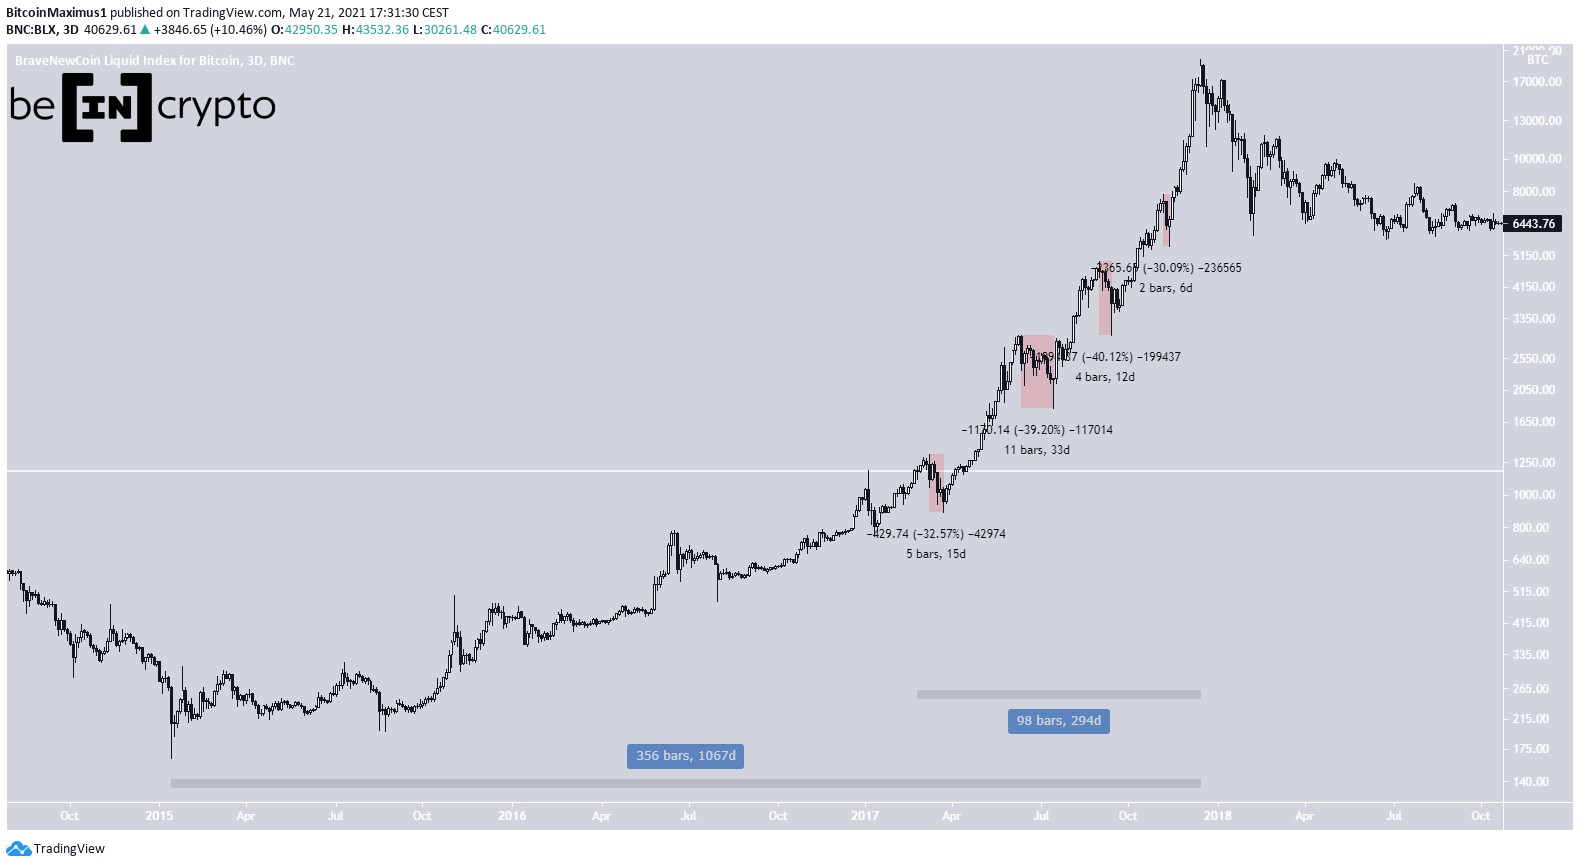
The rate of decrease for the current BTC correction has been sharp, but it still trails that which was reached in February.
January BTC correctionThe first correction began on Jan. 8, when BTC had just reached a then all-time high price of $41,936. The drop continued for 14 days, ending with a low of $28,809 being reached on Jan. 22.
This measured a decrease of 31.30%. This amounted to a rate of decrease of 2.21% per day.
After the correction was done, it took the price 17 days in order to reach a new all-time high, doing so on Feb. 8.
Therefore, it took it 1.21 the time of the correction in order to retrace it in its entirety.
Chart By TradingView February BTC correctionThe second correction started on Feb. 21, when BTC had reached a high of $58,321. The drop was sharp, measuring 26% in only seven days. This amounted to a rate of decrease of 3.71% per day, significantly higher than that on January.
Afterwards, it took the price 13 days to reach a new high. Therefore, 1.85 of the correction time was required in order for a full retracement and a new high.
Chart By TradingView March BTC CorrectionThe March drop was the mildest so far, measuring only 18%. It began on March 13, when BTC had reached a high of $61,681 and continued for 12 days.
The price corrected by 18%, for a rate of decrease of 1.5% per day. This value was the smallest out of the three corrections.
Afterwards, it took the price 19 days in order to reach a new high, or 1.58 times the length of the correction.
Chart By TradingView Current correctionThe current correction began on April 14. It has been sharp, since BTC has dropped by 26.76% in nine days. This amounts to a rate of decrease of 2.97% per day. So far, it is the second highest rate of decrease in 2021, only trailing that of February.
During the previous months, it took BTC between 1.25-1.84 times the length of the correction to reach a new high.
Therefore, even if it reversed trend today, a minimum of eleven days would be required for a new high to be reached if the previous patterns hold.
Chart By TradingView ConclusionTo conclude, while the ongoing BTC correction has been sharp, it is still well within the parameters set by the prior corrections in 2021.
For BeInCrypto’s latest bitcoin (BTC) analysis, click here.
The post Bitcoin’s Corrections In 2021: Analyzing Previous Market Dips appeared first on BeInCrypto.
origin »Bitcoin price in Telegram @btc_price_every_hour
Bitcoin (BTC) на Currencies.ru
|
|