2019-5-29 12:30 |
Bitcoin [BTC] and volatility are all, but synonymous. Since the cryptocurrency emerged a decade ago, it has seen wave after wave of price fluctuations. Hence, ardent crypto-investors have already made their peace with volatility. The current rally is no different.
In fact, this volatility is welcomed by the larger market as BTCs price has soared to a yearly high, with the bull run in full swing. However, mirroring effects of this rapid price change, experienced every day, seem to equate itself to the tidings of December 2018, touted as the rock-bottom of the dreaded crypto-winter, when Bitcoin hovered over $3,000.
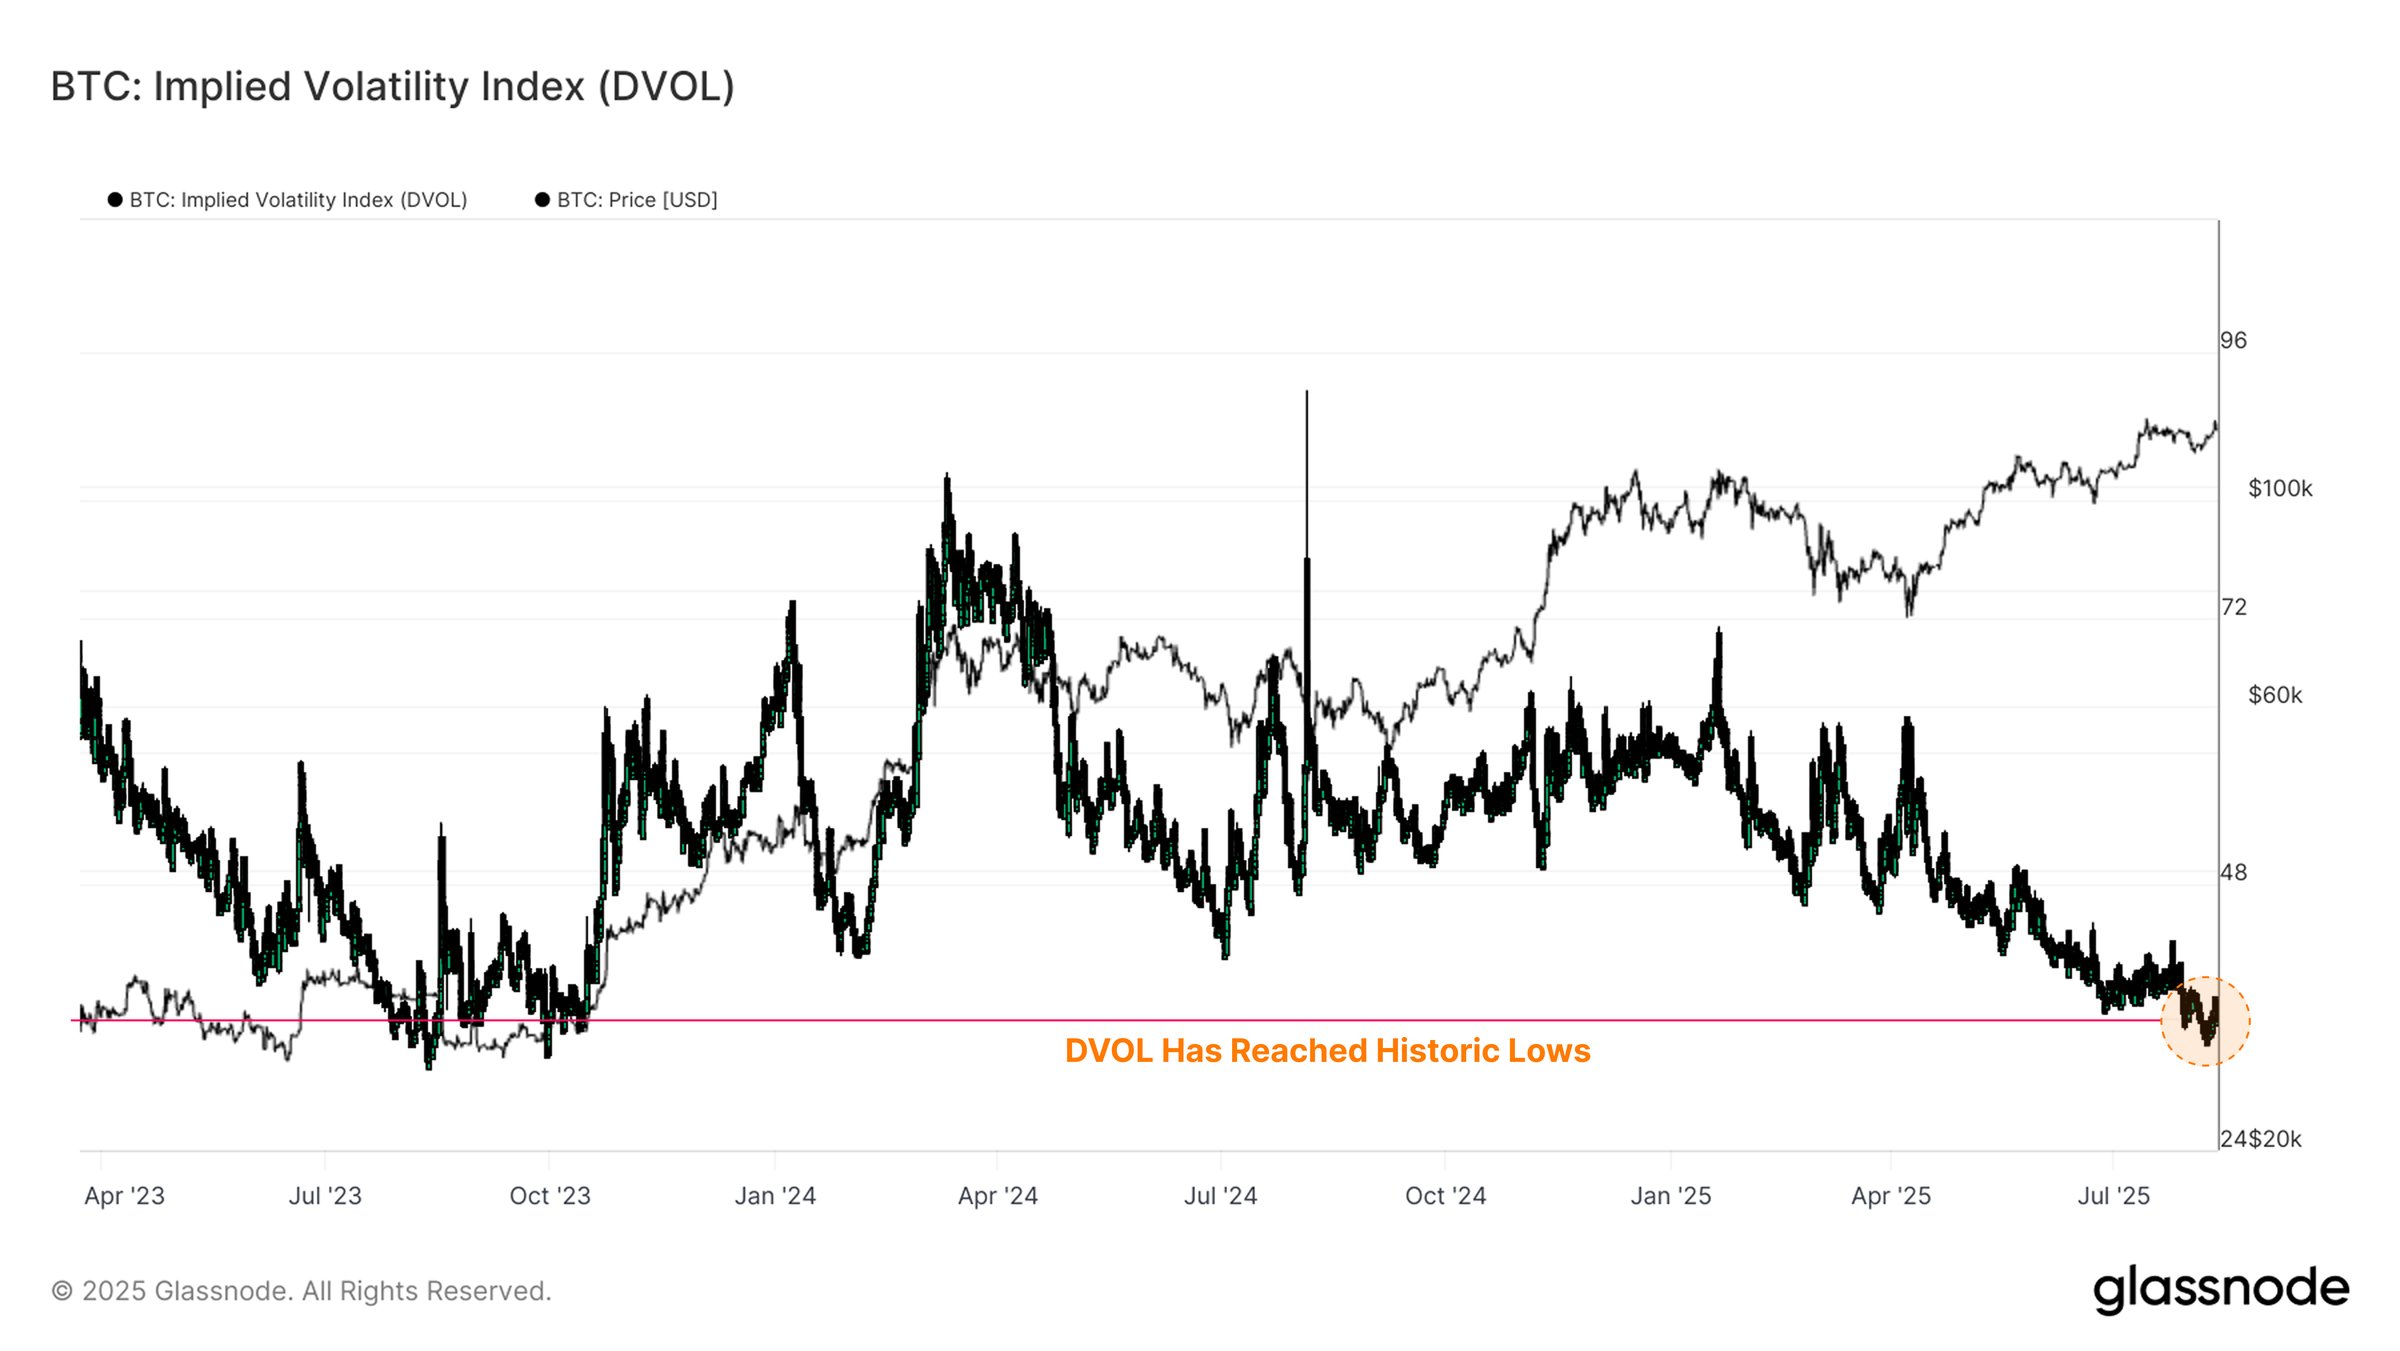
According to Bloomberg, the “average daily up and down moves in Bitcoin have gotten more pronounced.” Although this rapid price change, initiated in early April 2019, has been up rather than down, the volatility is concerning.
The report stated that the daily price change for the month of May [till the 28th] was averaged at 4.7 percent, while the same metric for April was 3.5 percent. The first quarter of the year saw a starkly different average of 1.4 percent. To put the May volatility in context, the average daily price change in December 2018 was 4.2 percent, albeit in the opposite direction.
Source: Bloomberg
After surging past $8,700 and priming for an ascendance over $9,000, the May 28 bears shaved Bitcoin’s price by 2.4 percent.
Bloomberg stated that the reasons for the price rally include interest from mainstream companies and Wall Street’s growing inclination towards the cryptocurrency industry, spearheaded by Fidelity, JP Morgan, and the hotly-anticipated Bakkt.
Looking inward, the report highlighted the imminent Bitcoin halving as being a source of the price push. With Bitcoin mining rewards set to drop by 50 percent in May 2020, the price historically, exhibits a price rally three months to one year prior to the event, as seen now. Quoting eToro’s Mati Greenspan, the article stated that it was down to “supply.”
Bloomberg’s Galaxy Crypto Index, in which Bitcoin takes only 30 percent despite dominating over 55 percent of the cryptocurrency market, seconds this rapid change. The index, which marks the price spread or the trading envelope bands, has expanded to the widest for the year.
Source: Bloomberg
The index tested its upper band during the May 28 decline and dropped down, as Bloomberg stated that this could be “a top for the foreseeable future.” Finally, 30-day volatility levels show that the currency market is nearing the December peak, as Bloomberg’s Intelligence analyst Mike McGlone concluded,
“The market is getting a bit stretched here from a trader’s standpoint.”
The post Bitcoin’s [BTC] market volatility mirrors December 2018; price tremors in the offing? appeared first on AMBCrypto.
origin »Bitcoin price in Telegram @btc_price_every_hour
Bitcoin (BTC) на Currencies.ru
|
|