2019-4-7 11:45 |
GREEN CANDLES!
When moon?
We’re going to $10,000 now!
Just some of the terms you see flying about in the crypto community the past week via various social media platforms.
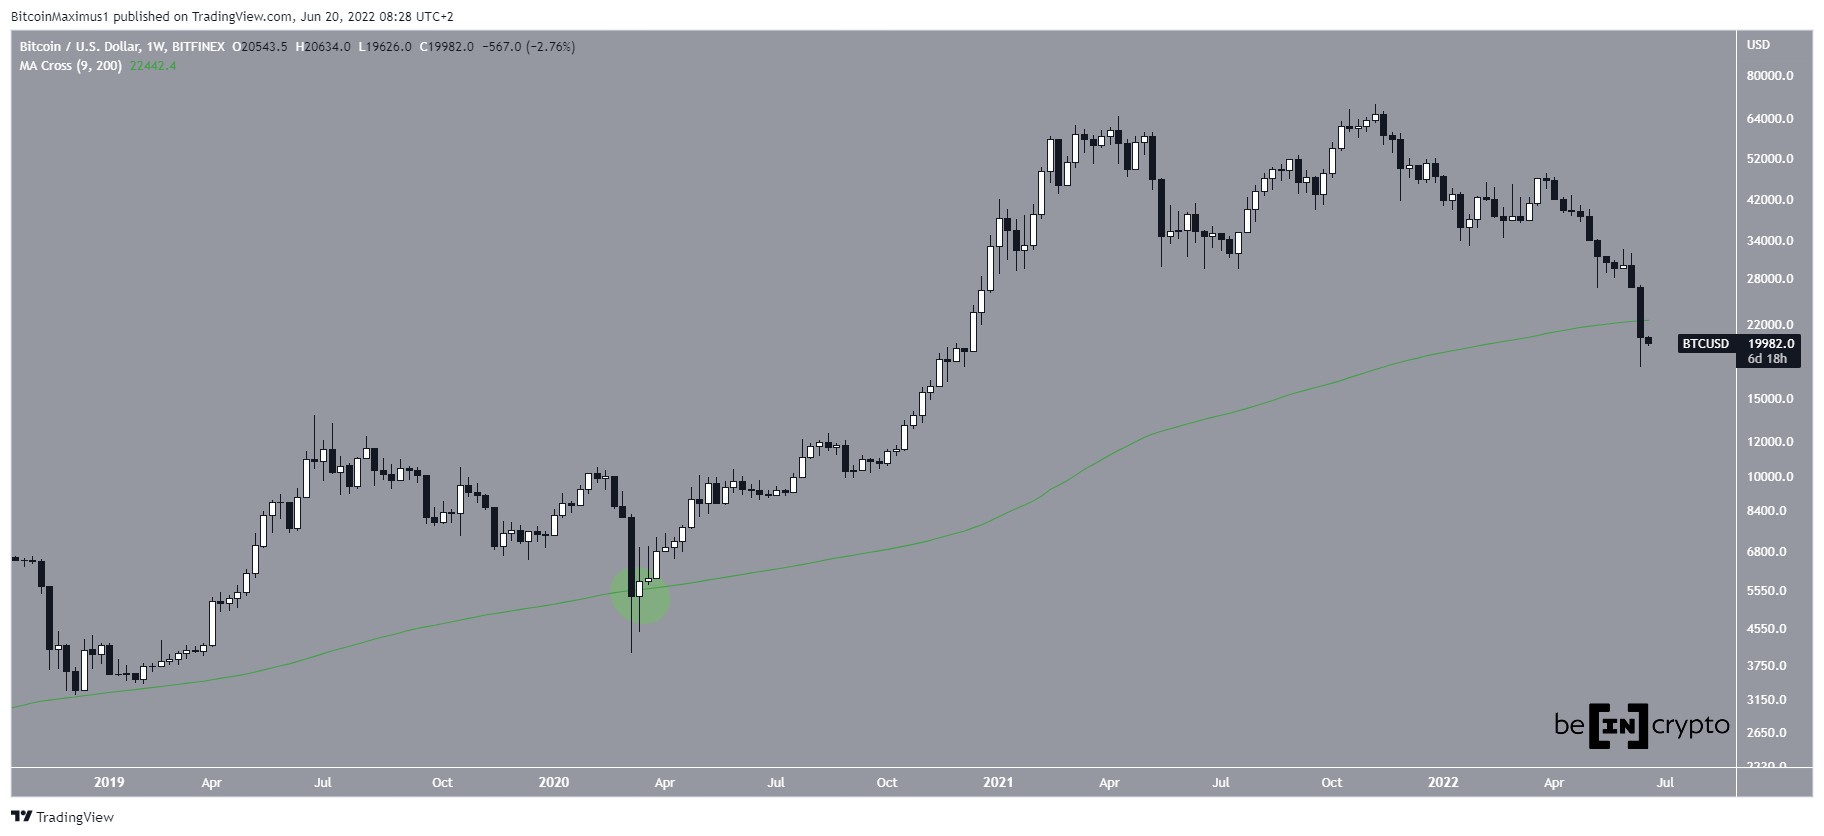
But if we just take a step back and zoom out, what is the Bitcoin weekly candle signaling or hinting?
I always like to analyze Bitcoin from a weekly and monthly perspective first as this can often give a very clear indication as to what we can be expecting.
Bitcoin has had a very a good run in the last few days with volume propelling price from $4,000 to $5,300 – An impressive 35% gain in price.
Bitcoin above 200 Moving AverageBitcoin finally broke out of the long term descending trend line after multiple higher lows formed and consolidated around the $4000 level to suggest a big move was imminent.
The volume on Bitcoin was enough to give some momentum to stay hovering around $5,000 and hold above the 200 Ma’s acting well as support.
The key question that will arise over the next couple of days will be whether Bitcoin can hold over $5,000?
If we can close above then I believe Bitcoin may be in for a push higher.
However from a top-down perspective if we look slightly closer, could this be nothing more than a retest of the $6,000 region before we fall back down?
The skeptic in me would lead me to think this may be the Bitcoin whales pushing the price higher in order to entice more investors in before we go lower.
Bitcoin in line with Fibonacci ToolThe Fibonacci tool currently in place fits perfectly in line to suggest we could meet the 61.8 fib at $6,000 or even push to the 78.6 fib at $6,600 level.
What would many people think?
The bear market is over finally!
I’m not quite convinced I’m afraid. If there is anything to take from this market it is to be fearful when everyone is greedy and greedy when everyone is fearful.
If Bitcoin manages to reach the $6,000 level I will like to see how it reacts and whether a reversal sends price back to the lower $3,000 level – In line with the -27 fib.
Final ThoughtsFor now, $3,000 is currently the bottom we have for Bitcoin.
If Bitcoin doesn’t double-bottom, it will be one of the only market reversals in crypto history that has only tested the bottom once.
The post Bitcoin Weekly Chart – What is BTC Telling Us? appeared first on ZyCrypto.
origin »Bitcoin price in Telegram @btc_price_every_hour
Bitcoin (BTC) на Currencies.ru
|
|