2020-4-10 16:10 |
The Bitcoin price has been increasing inside an ascending wedge since reaching a low on March 13. The rate of increase intensified on March 30, and it has been increasing without experiencing any major retracement since.
However, at the time of writing Bitcoin has decreased by more than 5% inside the day and reached a minor support level at $6,900.
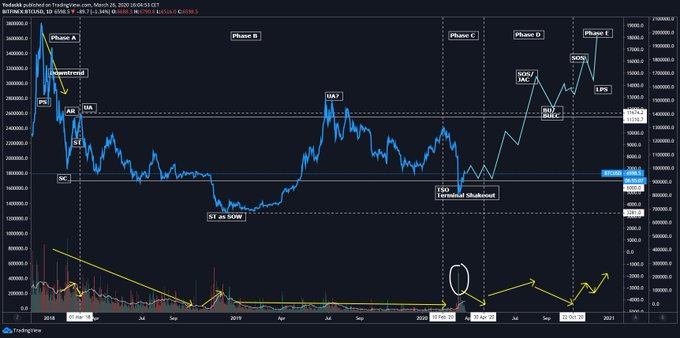
Full-time trader @damskotrades outlined a BTC chart that shows a long-term trading range between $6,700 and $7,700.
If the price decreases below the support level, there is a good chance that BTC will be subject to a rapid drop. However, the price might first try to retest the resistance level once more before finally decreasing towards support.
$BTC pic.twitter.com/HX7TMVBckM
— CryptoAmsterdam (@damskotrades) April 10, 2020
Bitcoin’s Ascending WedgeThe Bitcoin price has been trading inside an ascending wedge since reaching a low on March 13. At the time of publishing, it was trading just above the support line of this wedge. Therefore, even though the price is in the process of creating a bearish engulfing candlestick, it has yet to break down below the support line.
As long as it does not do so, the possibility remains that the price will increase towards the resistance line outlined in the tweet.
However, a breakdown below the ascending support line and the support level at $6,700 would likely cause BTC to rapidly decrease towards the next support area at $5,800, due to the lack of intermediate support below the current level.
Even if the price increases towards $7,700, it is expected to eventually break down, In most cases, the ascending wedge plays out as a bearish pattern and creates overhead resistance.
Bitcoin Chart By Trading View Long-Term OutlookThe weekly chart provides a similarly bearish outlook. The price is in the process of creating the fourth successive long upper-wick — a sign of considerable selling pressure.
In addition, it has failed to reach a weekly close above the previous support level found at $6,900 which has now turned resistance.
The outlook from the weekly time-frame aligns with the daily and suggests that the price will decrease towards the support level outlined above.
Finally, this support also coincides with the 200-week moving average (MA), making it a likely level for a trend reversal.
Bitcoin Chart By Trading ViewTo conclude, the BTC price was rejected strongly by the current resistance level and began a significant decrease on April 10. After possibly making another attempt at $7,700, the price is expected to break down from the current pattern and eventually head towards $5,800.
The post Bitcoin Teeters on Long-Term Support, Bulls Running out of Time appeared first on BeInCrypto.
origin »Bitcoin price in Telegram @btc_price_every_hour
Bitcoin (BTC) на Currencies.ru
|
|


