2020-9-14 12:08 |
Even though Bitcoin (BTC) has been moving upwards since Sept. 8, it has shown considerable weakness indicating that it is likely beginning a final wave down that could end at $9,700.
After the losses seen during the week of Aug 31-Sept 7, the Bitcoin price consolidated last week. The price created a small Doji candlestick above the $10,000 area, which had previously acted as resistance since February and is now expected to act as support.
Therefore, as long as the price is trading above this level, the current movement is considered a re-test of this support level.
Bitcoin Long-Term SupportTechnical indicators are neutral, leaning slightly bearish. The MACD has started to fall but has not been confirmed with a bearish close. Both the RSI and Stoch RSI are above 50 and have a positive slope.
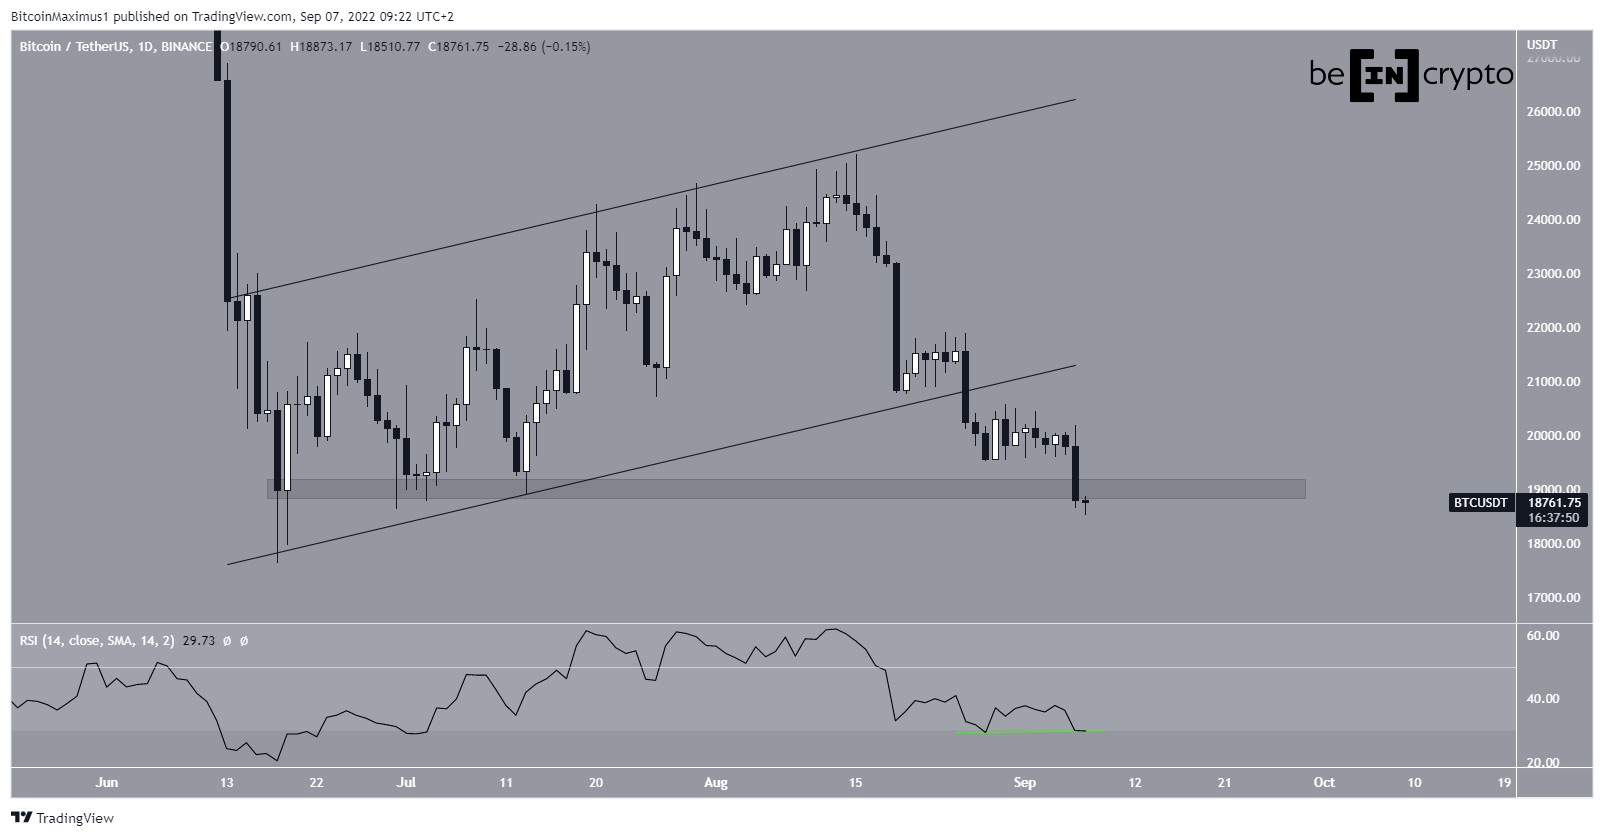
BTC Chart By TradingView Weak RetracementThe daily chart gives conflicting signs. While the price has been retracing since Sept 8, the upward move has been very weak. BTC has even failed to reach the 0.382 Fib level of the decrease at $10,681.
However, technical indicators are bullish. The MACD has been moving upwards along with the RSI and Stoch RSI. The latter is possibly getting ready to make a bullish cross.
BTC Chart By TradingViewThe shorter-term two-hour chart shows a deviation above the minor resistance area at $10,400 and a fall back inside. This same area is now expected to act as resistance once more.
Combined with the bearish divergence in the MACD and the fact that it has turned negative, this suggests that the price is likely to decrease.
BTC Chart By TradingView Wave CountsIn BeInCrypto’s Sept. 11 analysis, we stated that:
The Bitcoin price likely began a bearish impulsive five-wave formation on Sept. 2 and currently is in wave 4, which is transpiring inside a complex corrective structure.
The price action on Sept 13 makes it likely that BTC has completed wave 4 (in orange below) and has now begun its final decrease with wave 5.
Even though the price did not retrace significantly and failed to touch the 0.382 Fib level of the decrease, the fact that the movement is perfectly contained within a parallel channel and the impulsive decrease from late Sept 13 suggests the rally is likely finished.
The first possible target for the end of wave 5 would be at $9,718, found by the 0.382 Fib of waves 1-3.
BTC Chart By TradingViewA closer look at the decrease shows that the price has possibly completed sub-waves 1 and 2 (orange) inside the previously mentioned wave 5.
The current price level near $10,370 has a strong Fib confluence with both the bounce and the previous decrease. It presents a very likely level for the rally to end and the price to resume its downward movement.
BTC Chart By TradingViewFor BeInCrypto’s previous Bitcoin analysis, click here!
The post Bitcoin Rejection Could Signal a Final Leg Down appeared first on BeInCrypto.
origin »Bitcoin price in Telegram @btc_price_every_hour
Bitcoin (BTC) на Currencies.ru
|
|