2019-3-21 15:00 |
After peppering the $4,000 price point for days, Bitcoin price closed over above the $4k barrier for the first time in March. Let’s take a closer look at the price action to see it there is any sign that this time the price level can be maintained.
DAILY CHARTThe Daily Bitcoin price chart clearly shows that bitcoin price 00 is well underway with its fourth attempt to break $4k since the December 2018 lows. The market posture remains in that of a bottom pattern with an Adam and Eve and an inverse head and shoulders within the Eve Cup.
Should these classical charting patterns play out, it would imply a move towards a $5,000 bitcoin price would be on the cards. However volume remains low and this multi-month pattern is taking its time to grind out.
The MACD is crossed bullish with its signal line and remains in bullish territory, but is generally quite flat, which is also the case with the volume.
4-HOUR CHARTThe 4-hour chart shows that despite the daily close being above $4k, the previous resistance found at $4040 last week, remains an issue for the bulls. The task at hand is to go some way to confirm the move, and turn previous resistance at $4000 into support.
Should this occur and BTC begins to challenge $4200 to break the yearly highs, new buyers may start entering the market. This may also push out bearish positioned traders who will look to exit.
The MACD at the time of writing shows that the bulls are starting to look somewhat tired and significant buyers failed to step in at the start of the EU session.
Looking at the orderbook, we can see that sizable sell orders remain on the books, acting as a hurdle of liquidity suppressing the BTC price, which the bulls need to overcome. There are signs that the bulls are starting to backfill orders at $4000, however, which will be necessary to sustain price at these levels.
Failure to do so amidst low volume will potentially mean that the bears will step in and push the market back down to retest last week’s lows of $3850.
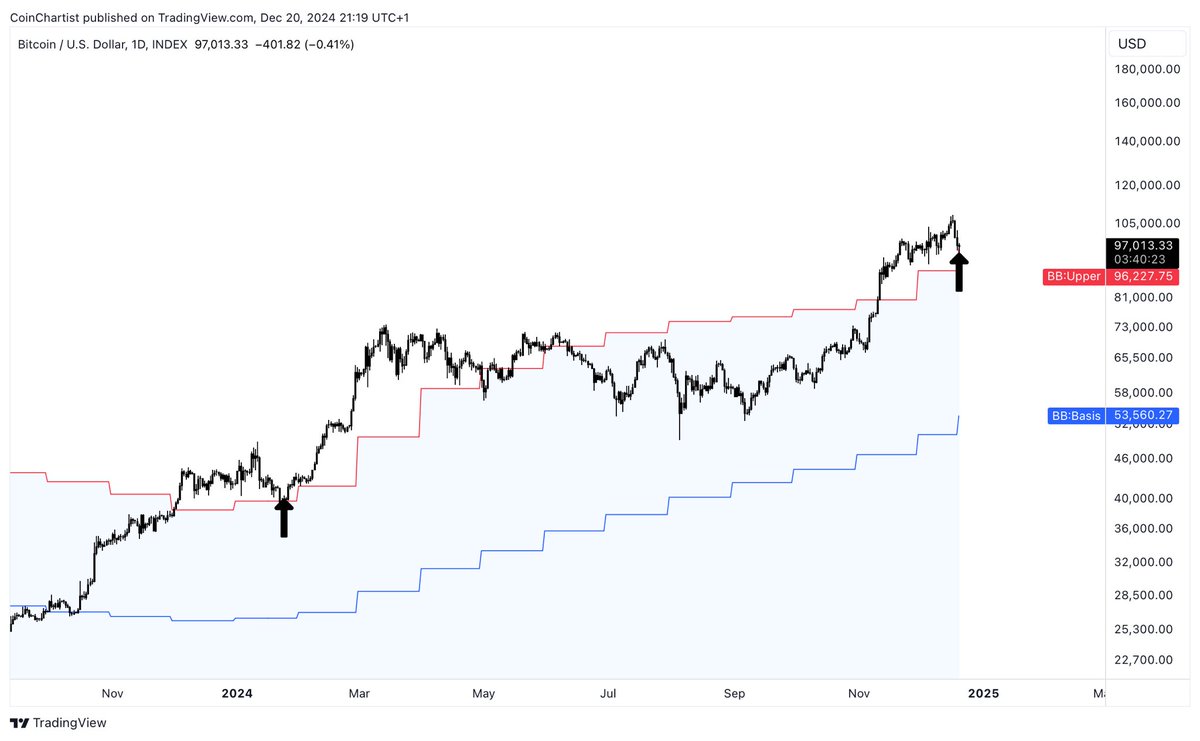
WEEKLY CHARTThe Weekly chart shows bitcoin is on its fifth consecutive weekly green candle and is notably mid break of the 20-week moving average (WMA), which is the center of the Bollinger bands. This would be significant as it has previously acted as resistance.
The upper band of the Bollinger bands, which is two standard deviations from the center line, provides confluence with the targets discussed of around $5000 for bitcoin price. Whereas a failure implies risk to the downside of around $2500. But this would mean the bears needing to break the 200 WMA, which has held on each asking thus far.
In summary, bitcoin price continues to grind its way higher but continues to threaten a more significant move. With 10 days remaining in March and with price being pressed against $4,000 once again, it is likely that the next move with be a definitive one in terms of dictating the price action for the following few weeks.
However, the market remains in bearish territory, which must not be overlooked. Higher highs across multiple timeframes will be the first step in a trend change. But until then, despite the good news on low timeframes, the macro view of bitcoin price remains bearish until proven otherwise.
Trade Bitcoin (BTC), Litecoin (LTC) and other cryptocurrencies on online Bitcoin forex broker platform evolve.markets.
To get receive updates for the writer you can follow on Twitter (@filbfilb) and TradingView.
The views and opinions of the writer should not be misconstrued as financial advice. For disclosure, the writer holds Bitcoin at the time of writing.
Images courtesy of Shutterstock, Tradingview.com
The post Bitcoin Price Analysis: BTC Breakthrough Means $5,000 Now In The Cards appeared first on Bitcoinist.com.
origin »Chronobank (TIME) на Currencies.ru
|
|


