2022-7-1 18:45 |
Bitcoin (BTC) created its first higher low since June 18, but has yet to break out from a horizontal and diagonal resistance level.
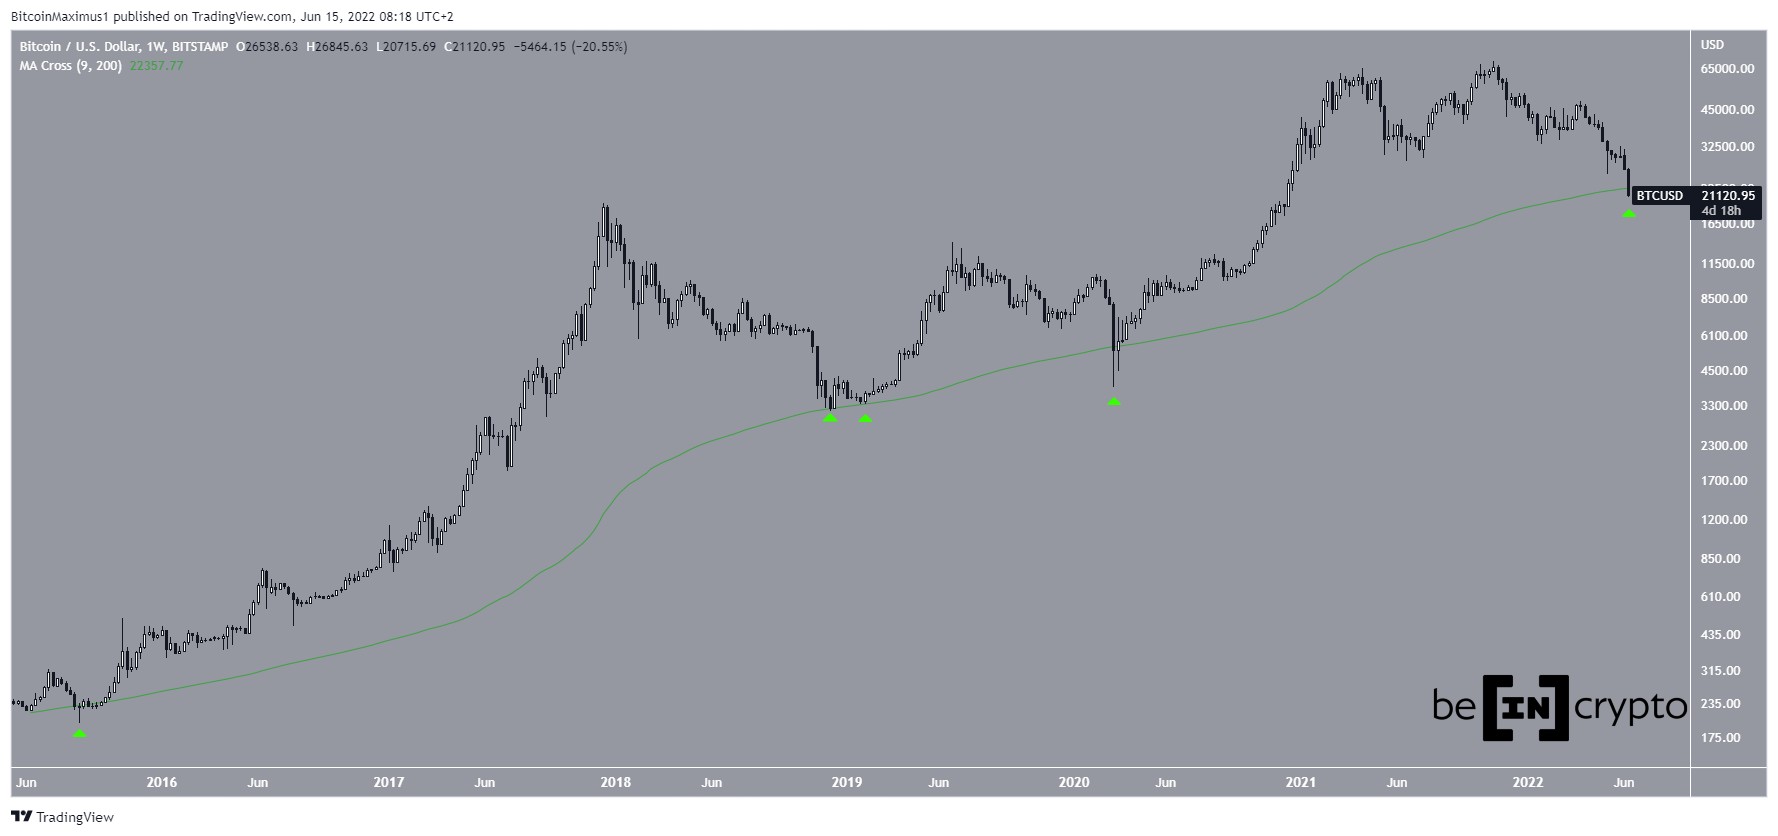
BTC has been falling since reaching an all-time high price of $69,000 in Nov. The downward movement has so far led to a low of $17,592 in June 2022.
The price has reached a monthly close below its 50-month moving average (MA) (orange). Previously, the MA has been crucial in initiating bounces, thus acting as the bottom after sharp falls (green icon).
However, that was not the case in June, since the price reached a close of $19,924 while the MA is at $21,600. Its reclaim is crucial if the bullish trend is to continue.
BTC/USD Chart By TradingView Short-term movementThe six-hour chart shows that BTC has created its first higher low since June 18. The higher low was made at the 0.618 Fib retracement support level at $19,250.
Additionally, while it seemed that the RSI had broken down from its bullish divergence trend line, it has now reclaimed it, rendering the previous decrease as only a deviation.
BTC/USDT Chart By TradingViewDespite this seemingly bullish development in the six-hour time frame, the two-hour one provides the exactly opposite reading, since the price has deviated above the $20,000 horizontal resistance area and a descending resistance line that has been in place since June 26.
Until these levels are reclaimed, the trend cannot be considered bullish.
BTC/USDT Chart By TradingView BTC wave count analysisThere are still several possibilities for the long-term wave count. On the other hand, there are two main possibilities for the short-term count.
The bullish outlook indicates that the price has completed an A-B-C corrective structure. So, the upward movement is now expected to continue.
Waves A:C have had a 1:1.61 ratio, which is common in such structures.
BTC/USD Chart By TradingViewThe bearish count indicates that the entire downward movement since the beginning of June is part of wave four (white) of a five-wave downward movement. So, in this case, the price would fall towards $16,000 before eventually reversing.
Whether the price manages to reclaim the previously outlined short-term resistance levels will likely determine which is the correct count.
BTC/USD Chart By TradingViewFor Be[in]Crypto’s previous bitcoin (BTC) analysis, click here
The post Bitcoin (BTC) Reaches First Ever Close Below 50-Month Moving Average (MA) appeared first on BeInCrypto.
origin »Bitcoin price in Telegram @btc_price_every_hour
Bitcoin (BTC) на Currencies.ru
|
|