2021-6-14 21:25 |
After two weekly closes in candlestick patterns indicative of price consolidation, an inverted hammer followed by a long-legged doji, with little movement from open to close, BTC/USD surged late on Sunday to close the weekly session at $39,013, up 9% from the week prior.
Last week was arguably one of the most significant weeks in Bitcoin’s history, as El Salvador passed a bill on Tuesday recognizing Bitcoin as legal tender, the first to do so with indications more Latin American countries may follow suit.
Later on Tuesday, the President of El Salvador proposed mining Bitcoin using hydrothermal power from active volcanoes in the country, of which there are 20, and work to set up mining farms has already begun in earnest.
Then on Saturday, Bitcoin’s most consequential upgrade since SegWit, Taproot, was locked in via a speedy trial miner signaling process with near-universal support, a stark contrast from the fractious saga SegWit had to endure before activation through UASF (User Activated Soft Fork).
Taproot brings privacy and scaling improvements to the Bitcoin protocol. But the real game-changer is that it enables even the most complex off-chain smart contracts on layer-2 protocols or sidechains to execute as a regular transaction on-chain. This could spell the beginning of the end for altcoins.
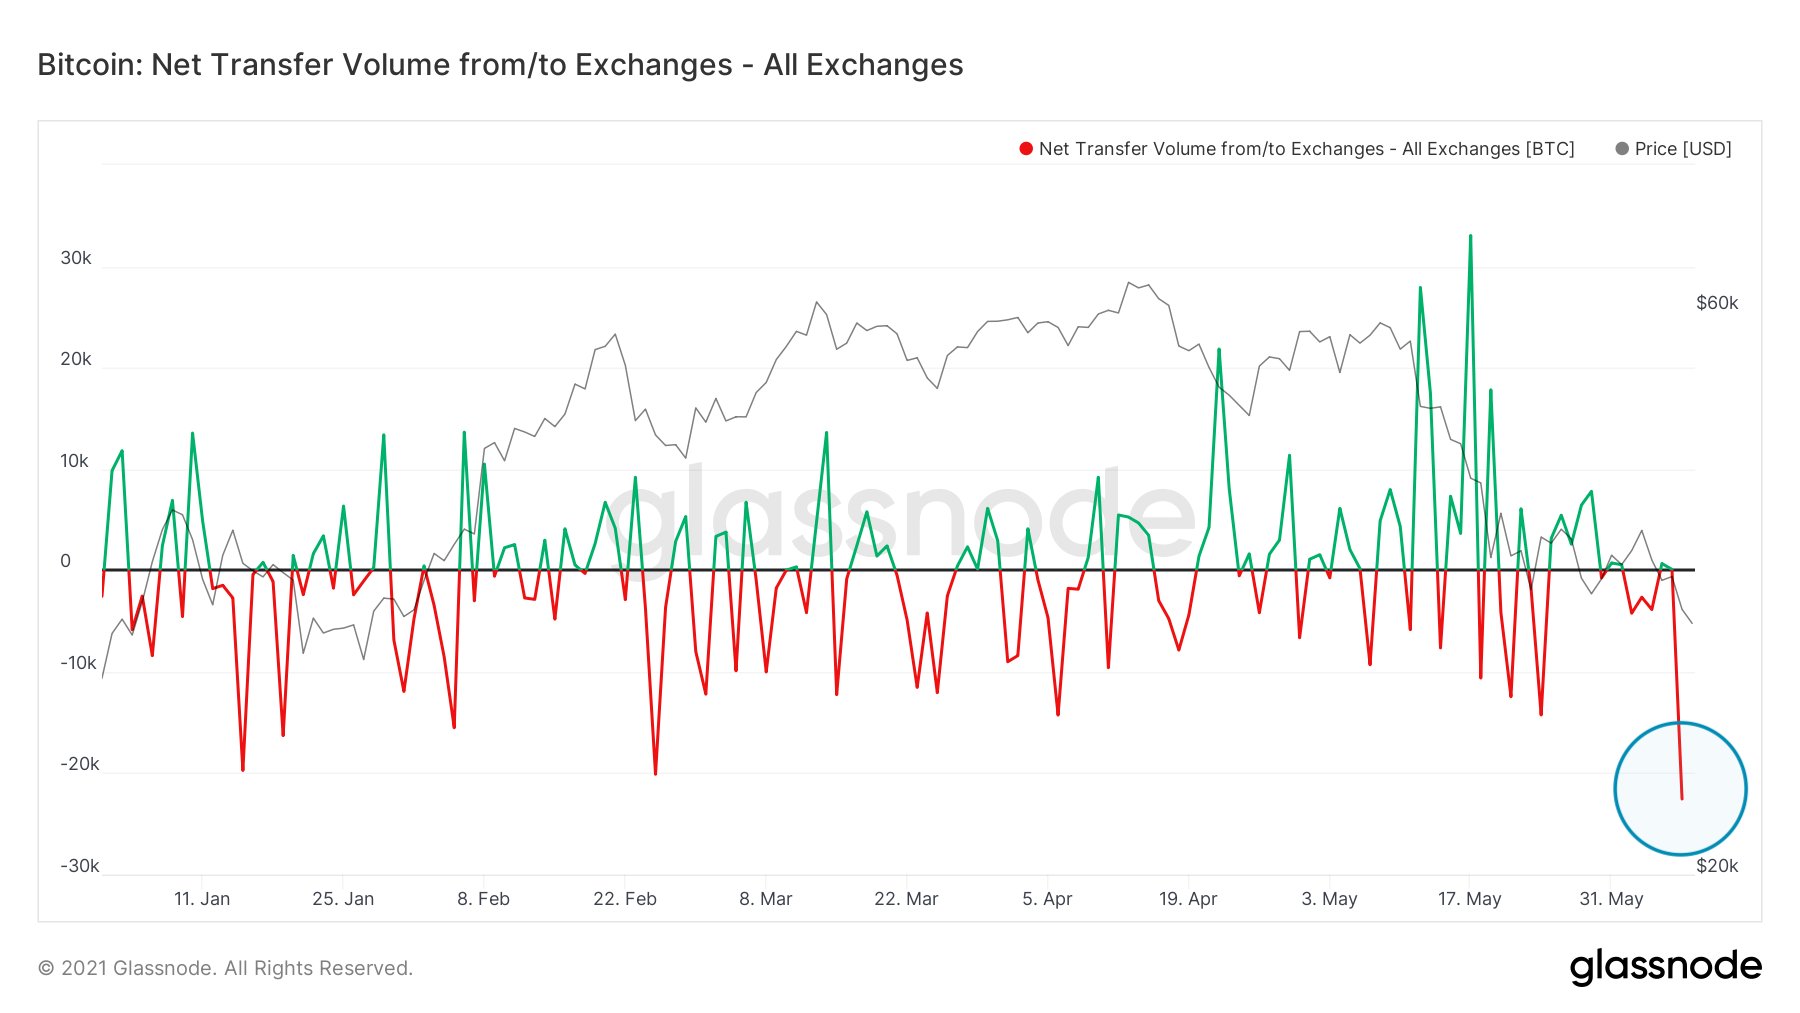
With such bullish developments both on and off-chain, last week saw the largest net outflow from exchanges this year by a significant margin. Large outflows indicate movement of coins to long-term HODL wallets.
For most of the week, though, the price action remained sluggish, but this was because in a ranging market following a significant drawdown, bulls tend to stagger their bids so as to not move the market too much, allowing them to lower average cost and accumulate without slippage.
The chart below could be used as a teaching guide for the Wyckoff accumulation phase. It’s absolutely unerring, and it became clear part-way through the phase that market makers were cognizant of this, hence the lack of kneejerk market reaction to the news from El Salvador.
After establishing preliminary support (PS), an automatic rally (AR) was rejected at the S/R flip at $43,000, price then remained ensconced within the established trading range before dipping below the established support level of the range to “spring” in a dragonfly doji pattern and breaking out at the end of the week following one last retest of the support.
A break above the range’s resistance level by daily close would confirm SOS (sign of strength) and completion of the accumulation phase into a bullish reversal.
Successive daily RSI divergence (charted below) was further confirmation of price bottom. Breakout from a descending channel was confirmed on Sunday. The price target for the breakout roughly coincides with the 0.382 Fibonacci retrace level and 50ma.
Speaking of 50ma, a death cross could be imminent unless the price rallies significantly over the next couple of days. However, we’ve seen this occur in the past where the 50ma has recovered to break above the 200ma again in short order. Momentum over the next week or two leading to monthly close will determine if that proves to be the case.
Market Summary Key support levels – $38,300, $37,400 Key resistance levels – $40,900, $43,000 Market outlook – Bullish continuation Bitcoin/USD BTCUSD 40,077.5170 $2,693.21 6.72% Volume 51.5 b Change $2,693.21 Open$40,077.5170 Circulating 18.73 m Market Cap 750.85 b baseUrl = "https://widgets.cryptocompare.com/"; var scripts = document.getElementsByTagName("script"); var embedder = scripts[scripts.length - 1]; var cccTheme = {"Chart": {"fillColor": "rgba(248,155,35,0.2)", "borderColor": "#F89B23"}}; (function () { var appName = encodeURIComponent(window.location.hostname); if (appName == "") { appName = "local"; } var s = document.createElement("script"); s.type = "text/javascript"; s.async = true; var theUrl = baseUrl + 'serve/v1/coin/chart?fsym=BTC&tsym=USD'; s.src = theUrl + (theUrl.indexOf("?") >= 0 ? "&" : "?") + "app=" + appName; embedder.parentNode.appendChild(s); })(); var single_widget_subscription = single_widget_subscription || []; single_widget_subscription.push("5~CCCAGG~BTC~USD"); The post Bitcoin (BTC) Price Trading Analysis June 14: Market Outlook Bullish Continuation, Here’s Why first appeared on BitcoinExchangeGuide. origin »Bitcoin price in Telegram @btc_price_every_hour
Bitcoin (BTC) на Currencies.ru
|
|