2021-12-16 12:11 |
Bitcoin (BTC) continued showing signs of a bullish reversal with its increase on Dec 15. This reversal would be confirmed by a breakout from the current short-term pattern.
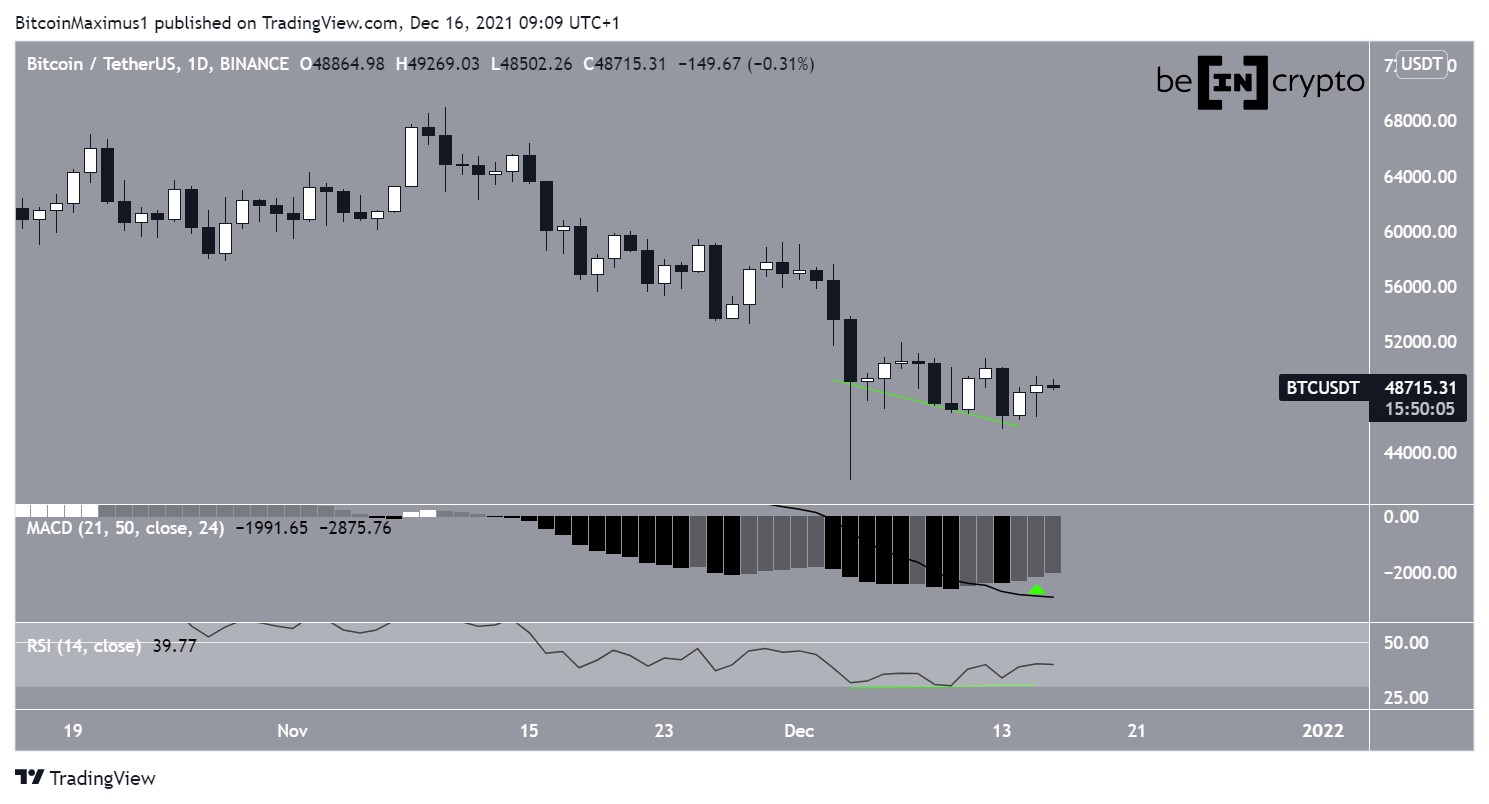
The daily chart shows that BTC increased slightly on Dec 15, though it has yet to reclaim the highs of Dec 13.
Technical indicators are showing strong signs of a potential bullish reversal. This is especially evident by the bullish divergence that is present in the RSI (green line). This often precedes bullish trend reversals since it means that the price drop was not accompanied by a drop in the buying momentum.
In addition to this, the MACD has created successive higher momentum bars. The MACD is created by short and long-term moving averages (MA) and means that the short-term MA is accelerating when compared to the long-term average.
Therefore, the daily time frame suggests that a reversal could occur soon, even if it’s not yet confirmed.
BTC Chart By TradingView Current patternThe six-hour chart further solidifies the findings from the daily outlook, showing an even more pronounced bullish divergence that is also visible in the MACD. This increases the possibility that BTC will eventually breakout.
In addition to this, BTC is trading inside a descending parallel channel. This is normally considered a corrective pattern, meaning that a breakout from the channel would be the most likely scenario.
If this occurs, the closest resistance would likely be found between $52,450 and $55,650. This target range is created by the 0.382-0.5 Fib retracement resistance levels.
BTC Chart By TradingViewFinally, there is a similar channel in the hourly time frame. After yesterday’s increase, BTC is in the upper portion of this channel, approaching the breakout level at $49,500.
BTC Chart By TradingView BTC wave countThe long-term count indicates that BTC is still mired in a correction.
The short-term wave count suggests that it’s in the C wave of an A-B-C movement. In such structures, the most common ratio for waves A:C is 1:1, meaning that they have the same length.
This would lead to a high near $55,800, aligning with the previous Fib resistances.
BTC Chart By TradingViewFor BeInCrypto’s previous Bitcoin (BTC) analysis, click here
The post Bitcoin (BTC) Makes Another Push At Reclaiming $50,000 Level appeared first on BeInCrypto.
origin »Bitcoin price in Telegram @btc_price_every_hour
Bitcoin (BTC) на Currencies.ru
|
|


