2022-7-8 11:00 |
Bitcoin (BTC) has been moving upwards since June 18 and finally managed to break out from an inverse head and shoulders pattern on July 7.
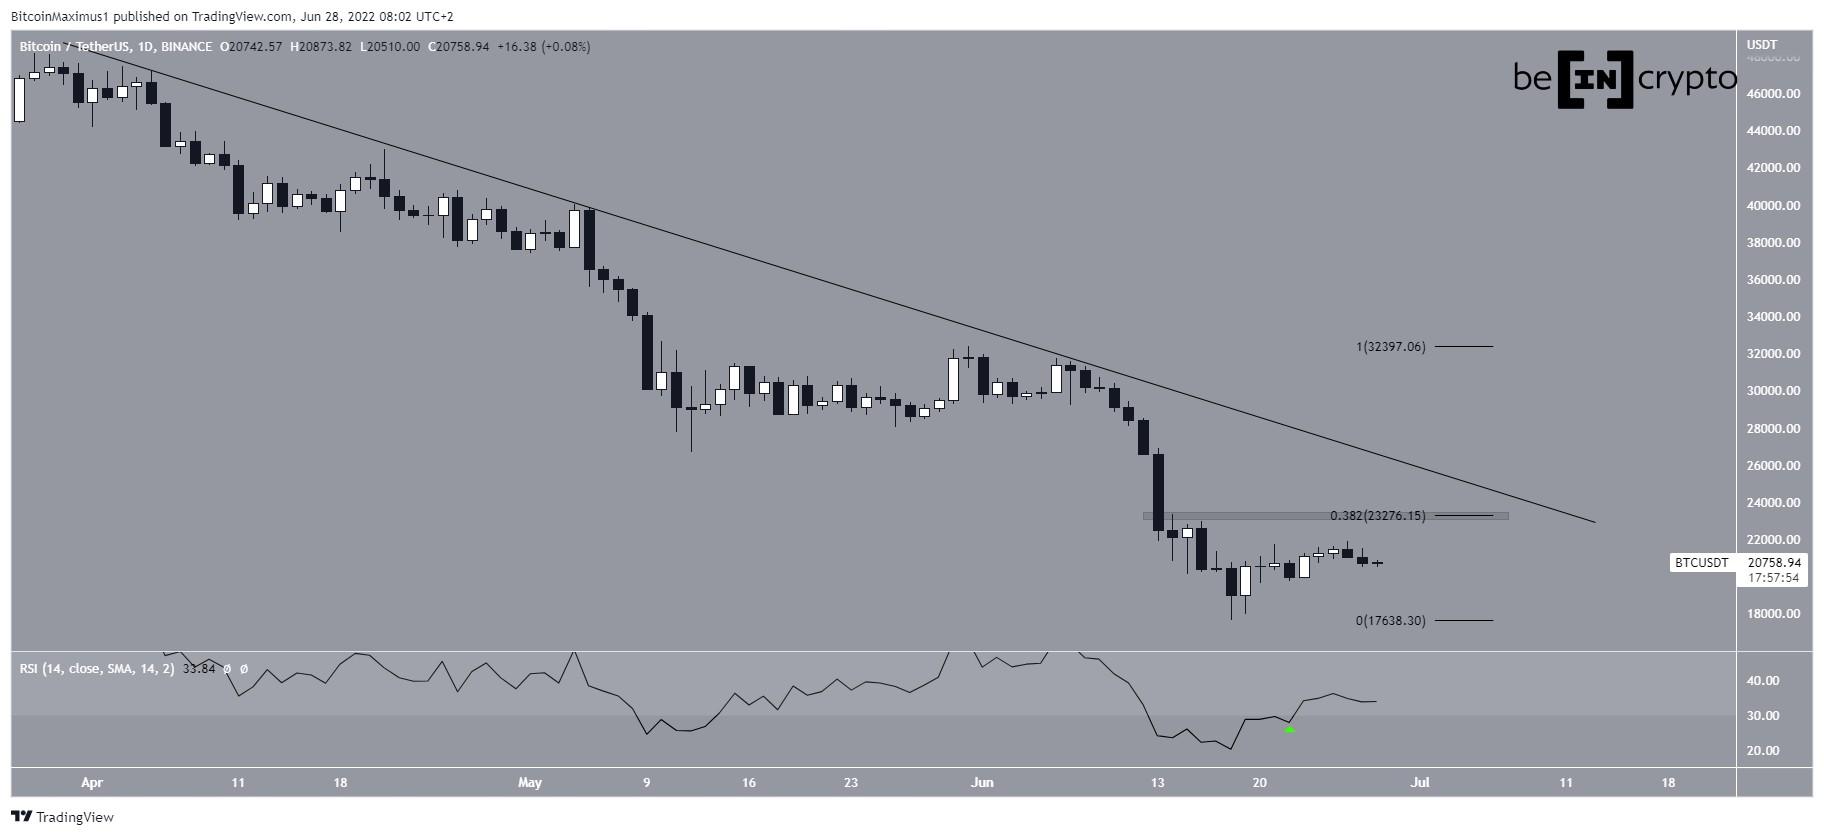
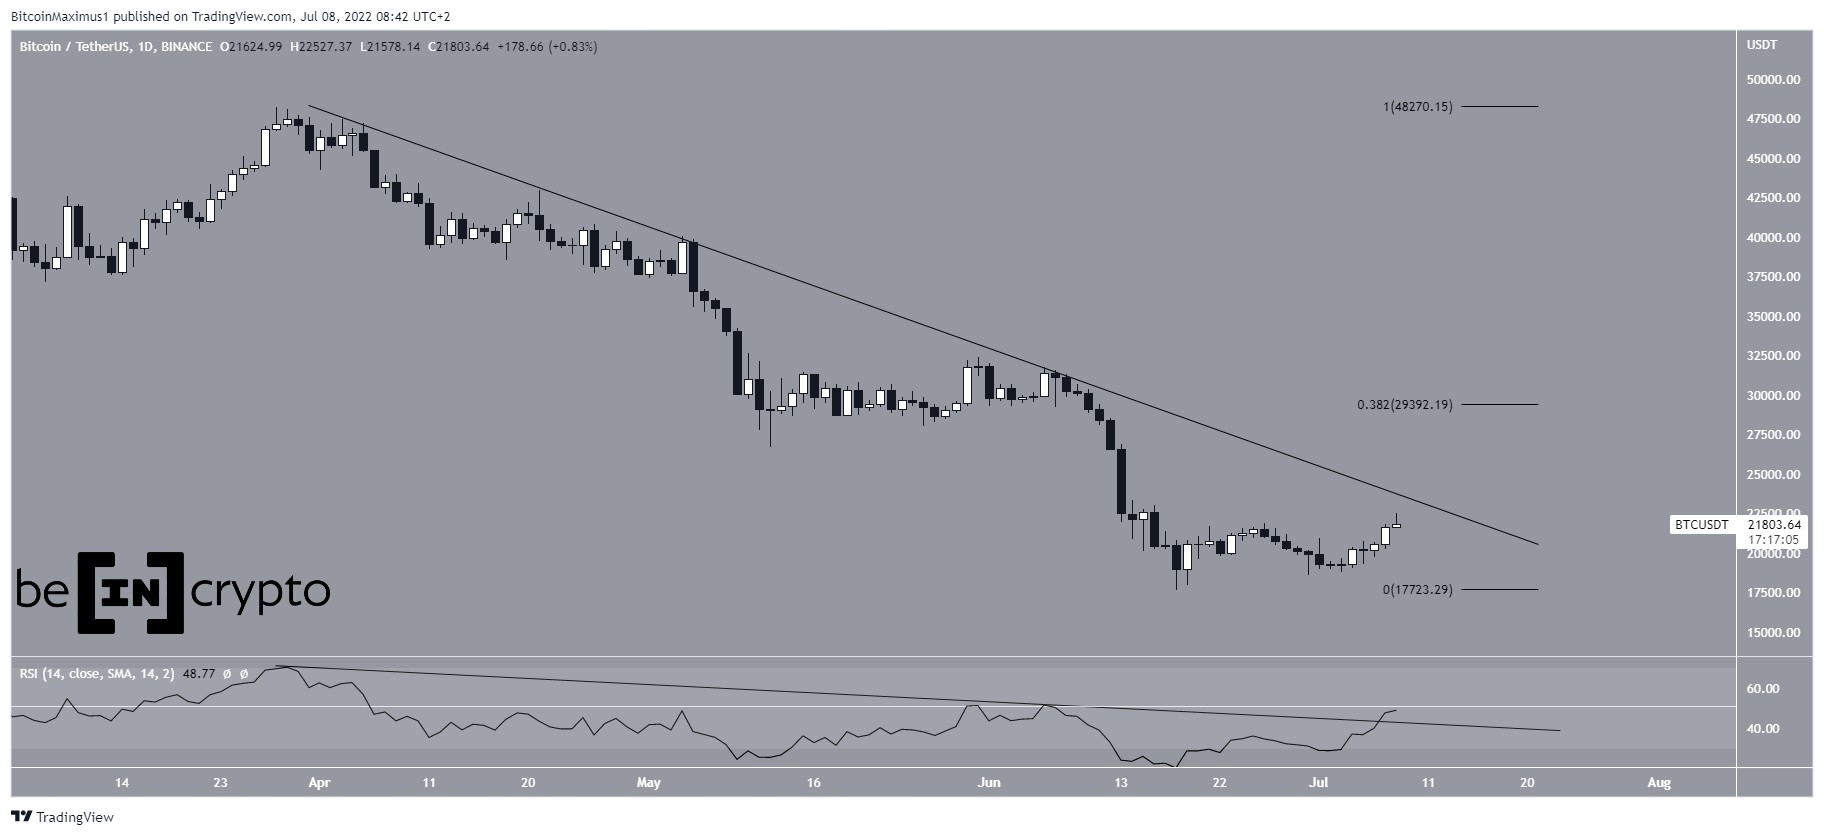
BTC has been decreasing underneath a descending resistance line since April 5. The line caused a rejection on June 7, which led to a low of $17,622 on June 18. The price bounced afterwards and has been increasing since, creating a higher low on July 3.
An interesting development is the daily RSI breakout from a descending resistance line. The line had previously been in place since March 29. Such RSI breakouts often precede a price breakout. So, it is possible that BTC will break out from its line, which is at $22,500.
If a breakout occurs, the price could increase all the way to $29,400, the 0.382 Fib retracement resistance level.
BTC/USDT Chart By TradingViewSince April 2021, the RSI has broken out from such descending trendlines twice. The first time led to an 111 day upward movement in which the price increased by 121%. The second one led to a 29% upward movement that transpired over 60 days.
So, if previous history is followed, a similar upward movement will ensue.
BTC/USDT Chart By TradingView Short-term breakoutThe six-hour chart shows that BTC has broken out from what looks like an inverse head and shoulders pattern. This is a bullish pattern that often leads to bullish trend reversals.
A movement that travels the entire height of the pattern would take the price to $25,000. Currently, the price is at the $22,700 resistance area, which coincides with the previously outlined descending resistance line.
So, if the price manages to clear it, the rate of increase would be expected to accelerate.
BTC/USDT Chart By TradingView Future BTC movementThe wave count suggests that since the descending resistance line began on April 5, the price has completed a five-wave downward movement (black). Additionally, the fifth wave has a completed five sub-wave count (yellow). As a result, a significant upward movement would be likely, aligning with the readings from the daily chart.
The most likely long-term wave count also suggests that a bottom has been reached.
BTC/USD Chart By TradingViewFor Be[in]Crypto’s previous bitcoin (BTC) analysis, click here
The post Bitcoin (BTC) Finally Breaks out From Short-Term Pattern appeared first on BeInCrypto.
origin »Bitcoin price in Telegram @btc_price_every_hour
Bitcoin (BTC) на Currencies.ru
|
|