2021-8-2 09:44 |
Bitcoin (BTC) increased considerably last week, reaching a high of $42,559 and closing just below $40,000.
BTC has deviated above the $40,550 resistance area and broke down from an ascending support line afterwards.
Long-term BTC movementBTC increased considerably during the week of July 23 – Aug. 1.
It initially managed to reach a high of $42,599 before creating a long upper wick and closing just below $40,000.
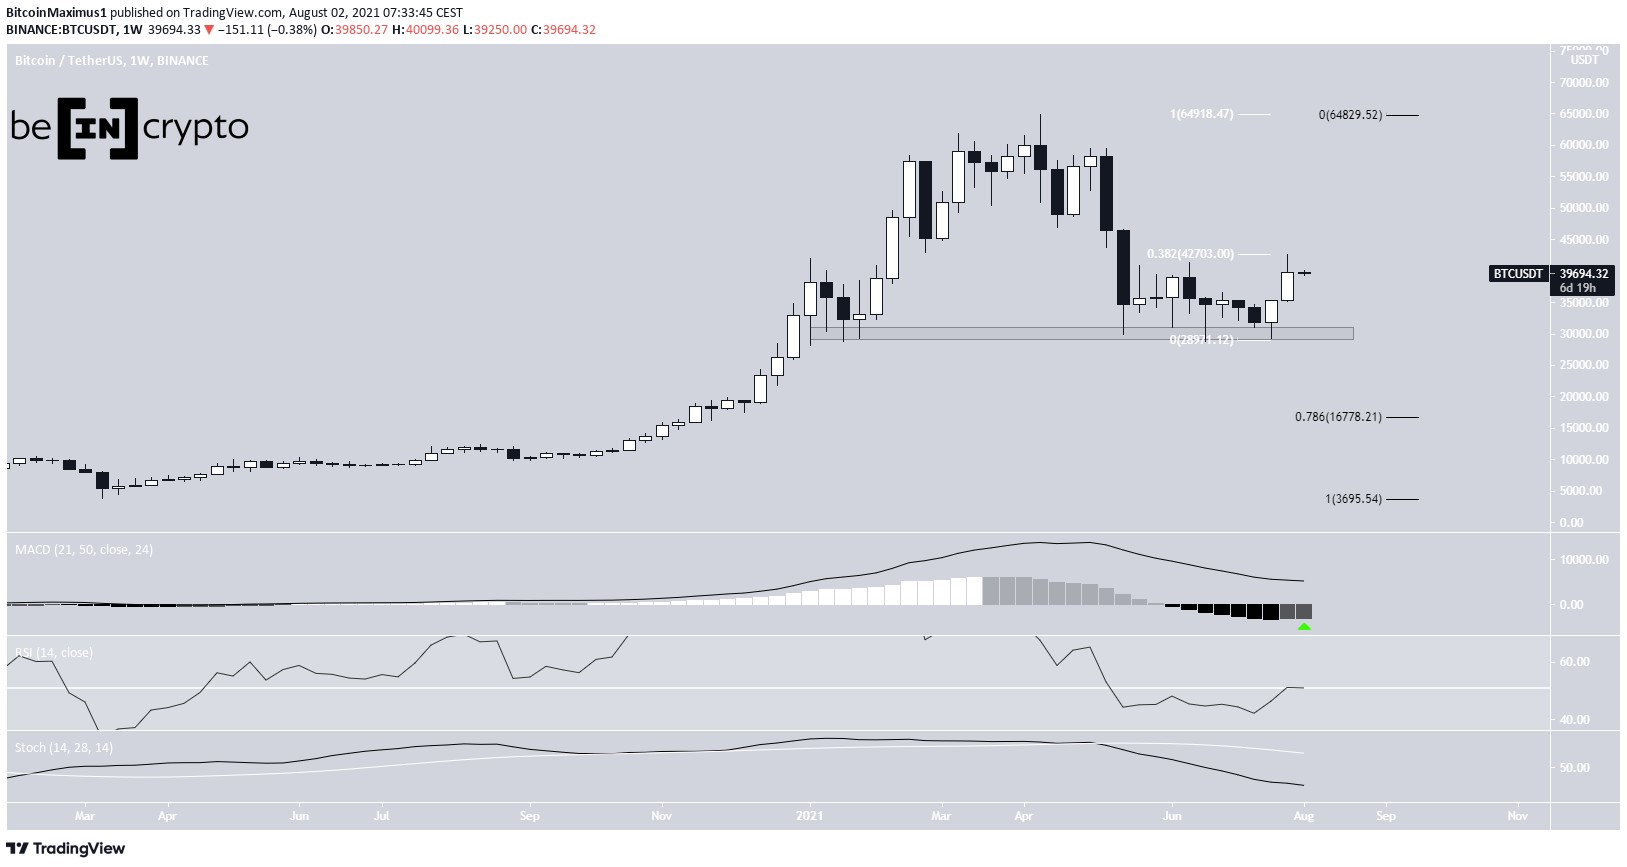
The high was made very close to the 0.382 Fib retracement level (white) when measuring the entire downward movement.
The main support level is found at $30,000. BTC has not reached a close below this price since the beginning of the year. Rather, it has bounced each time it has fallen to that level.
Despite the bounce, technical indicators are still bearish. The MACD has created one higher momentum bar but the signal line is still decreasing. Furthermore, the RSI is at the 50-line and the Stochastic oscillator has made a bearish cross.
Below $30,000, the main support is found at $16,778. This is the 0.786 Fib retracement support level (black).
BTC Chart By TradingView Deviation above range highThe daily chart shows that while BTC initially increased above the $40,550 resistance area, the movement turned out to be a deviation (red circle).
BTC has now fallen back below the $40,550 area. This is a bearish development that often leads to a sharp move in the other direction.
While technical indicators are still bullish, they are showing some bearish signs. The RSI has crossed below 70 and the MACD has created one lower momentum bar.
BTC Chart By TradingViewThe six-hour chart shows even more weakness in the form of a breakdown from an ascending support line.
BTC is approaching the 0.382 Fib retracement support level at $37,450. The next support is found at $34,320. This is the 0.618 Fib retracement support level.
The breakdown was preceded by bearish divergences in both the MACD and RSI.
BTC Chart By TradingView Wave countThe wave count suggests that BTC is in C wave of an A-B-C corrective structure (orange).
It’s already reached the $42,181 level, giving waves A:C a 1:1.61 ratio. Therefore, it’s possible that a top has been reached.
BTC Chart By TradingViewThe two-hour chart contains the sub-waves (red) and shows even more confluence of a top near $42,500. The same target is given by the length of sub-wave one (black) and the projection of sub-waves 1-3 (red) further supporting the theory of a top being reached.
If correct, BTC could decrease in the medium-term.
BTC Chart By TradingViewFor BeInCrypto’s previous bitcoin (BTC) analysis, click here.
The post Bitcoin (BTC) Deviates Above $40,550 Resistance Area Before Falling appeared first on BeInCrypto.
origin »Bitcoin price in Telegram @btc_price_every_hour
Bitcoin (BTC) на Currencies.ru
|
|


