2021-9-10 11:19 |
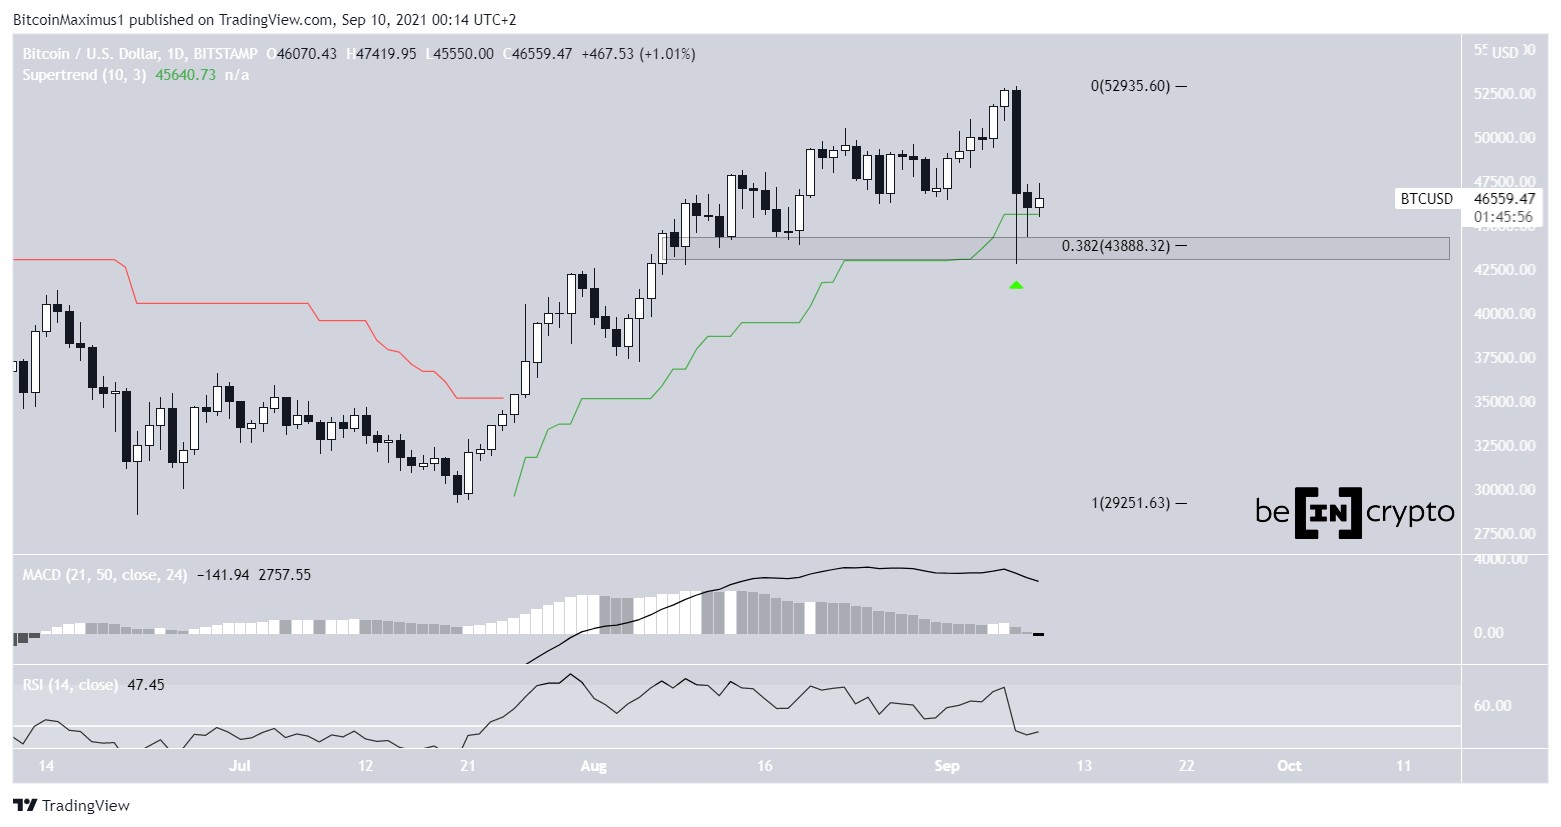
Bitcoin (BTC) is still hovering above the $43,900 support area, which pushed the price back up after a dip on Sept 7.
While there are short-term bullish signals in place, the ongoing bounce looks corrective. Therefore, it’s unlikely to be a bullish trend reversal.
BTC bouncesBTC decreased considerably on Sept 7, falling to a low of $42,483. However, it bounced afterward and created a long lower wick.
The bounce validated the $43,900 horizontal area as support. This is the 0.382 Fib retracement support level and a horizontal support area. Furthermore, it validated the Supertrend line as support (green).
However, while the price action still looks bullish, the MACD and RSI have both turned bearish. The MACD histogram has turned negative while the RSI has moved below 50.
BTC Chart By TradingView Future movementThe two-hour chart shows that the ongoing bounce is trading inside an ascending parallel channel. Such channels usually contain corrective structures. The increase has been combined with an increase in both the MACD and RSI.
The main resistance levels are found at $47,850 and $49,050. These are the 0.5 and 0.618 Fib retracement levels respectively.
As long as BTC is increasing inside the channel, the price is likely to reach these targets. However, a breakdown could mean that the upwards correction has ended.
In any case, an eventual breakdown from the channel is likely.
BTC Chart By TradingView Wave countThe wave count suggests that the decrease is likely part of wave A of an A-B-C corrective structure (orange).
The sub-wave count is shown in black, indicating that there could be another drop to complete wave A.
While the long-term count is still unclear, it’s likely that a short-term drop occurs first.
BTC Chart By TradingViewFor BeInCrypto’s latest Bitcoin (BTC) analysis, click here.
The post Bitcoin (BTC) Continues Hovering Above Support Zone appeared first on BeInCrypto.
origin »Bitcoin price in Telegram @btc_price_every_hour
Bitcoin (BTC) на Currencies.ru
|
|


