Bitcoin (BTC) Continues Consolidation Phase Near $20,000 Support Level

Bitcoin (BTC) Continues Consolidation Phase Near $20,000 Support Level
фото показано с : beincrypto.com

2022-7-15 11:15

Bitcoin (BTC) rebounded by $2,000 since July 13, but the price action has yet to move outside of its consolidation pattern.

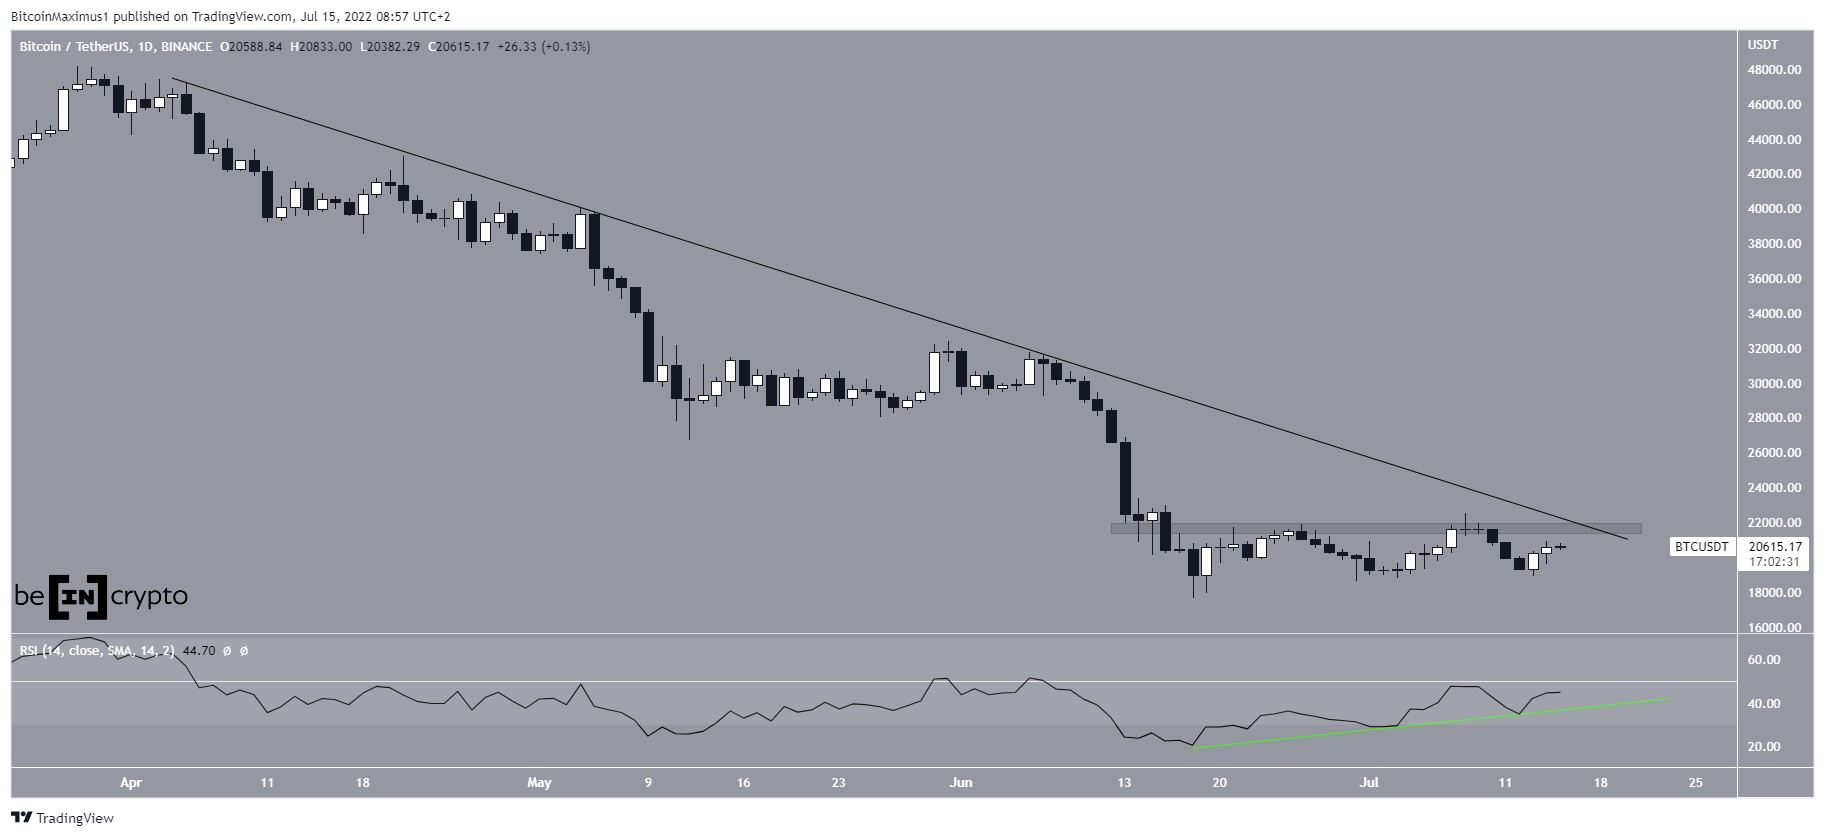
Bitcoin has been trading beneath a descending resistance line since April 5. So far, the downward movement has led to a long-term low of $17,622 on June 18. 

The price has been increasing since then but has yet to reach the descending resistance line, which is currently found near $21,700. Now, the line also coincides with the $21,700 horizontal resistance area, which has been reached twice recently. Both times, this line caused a rejection. 

The daily RSI has also been increasing above an ascending support line (green) but has yet to generate any sort of bullish divergence. Additionally, it’s still below 50.

So, the $21,700 area provides a confluence of resistances, created by the descending resistance line and the horizontal resistance area. Furthermore, if the price reaches this level again, the RSI would likely face resistance from the 50-line.

BTC/USDT Chart By TradingView Short-term channel

The six-hour chart shows that the price has been moving inside an ascending parallel channel since June 18. Such channels usually contain corrective movements, suggesting that an eventual breakdown is likely.

Additionally, BTC is currently in the middle portion of the channel and facing resistance from its midline (red circle).

Until it manages to reclaim this level, the trend cannot be considered bullish. 

BTC/USDT Chart By TradingView BTC wave count analysis

The long-term wave count suggests that a bottom will be reached soon. 

As for the short-term count, there are two main possibilities. 

The bullish count suggests that the price has completed a five-wave downward move, in which wave five was truncated. The fact that waves one and five have an exact 1:1 ratio supports this possibility.

BTC/USD Chart By TradingView

The more bearish count suggests that the price is still in wave five (yellow). The sub-wave count is shown in black and suggests that the price is in sub-wave five.

A movement above the sub-wave one low (red line) at $21,225 would invalidate this particular wave count.

BTC/USD Chart By TradingView

For Be[in]Crypto’s previous bitcoin (BTC) analysis, click here.

The post Bitcoin (BTC) Continues Consolidation Phase Near $20,000 Support Level appeared first on BeInCrypto.

Similar to Notcoin - TapSwap on Solana Airdrops In 2024

origin »

Bitcoin (BTC) на Currencies.ru

$ 67148.75 (-0.05%)
Объем 24H $24.615b
Изменеия 24h: 1.28 %, 7d: 10.52 %
Cегодня L: $66739 - H: $67313.92
Капитализация $1322.827b Rank 1
Цена в час новости $ 20870.2 (221.74%)

bitcoin consolidation btc continues level support phase

bitcoin consolidation → Результатов: 126


Bitcoin Will Move Like a “Bulldozer” Once It Gains Momentum, Claims Analyst

Bitcoin’s price appears to have entered yet another consolidation phase as it trades between $11,400 and $11,600 Its present lack of momentum comes close on the heels of the strong move higher that it posted last week The resistance above its current price level is quite intense, and this may mark an attempt from bulls to garner greater buy-side support Where the market trends in the mid-term will likely depend largely on whether Bitcoin’s consolidation […]

2020-10-15 21:00


Фото:

Sunday Digest: Bitcoin Price Consolidation, And The SEC Spoils The Party

Japan was hit by Typhoon Hagibis this weekend, causing devastation and affecting both the Japanese Grand Prix and Rugby World Cup. So what has been causing devastation and affecting bitcoin and cryptocurrency markets for the past week? Bitcoin Price: Consolidation Station So it seems we are back in a consolidation phase, albeit around the lower underlying price point of $8k.

2019-10-14 19:00


Bitcoin Cash (BCH) Daily Price Forecast – October 10

  BCH/USD Medium-term Trend: Ranging Supply zones: $800, $900, $1000 Demand zones: $300, $200, $100 BCH still remains in consolidation in its medium-term outlook. $517.70 in the demand area was the low the cryptocurrency attained as the bearish pressure within the range continues before the end of yesterday session. The 4-hour opening candle at $520.50 […]

2018-10-10 21:01


Фото:

Bitcoin Price Analysis: Potential Reaccumulation Could Test Bear Trend

Last week, after a devastating move that shook the market violently up and down for a 7% move in just a few short minutes, bitcoin saw a major sign of strength as it proceeded to have a slow, but steady markup where it managed to establish a local high in the $6,800s:Figure 1: BTC-USD, Hourly Candles, Shakeout Prior to MarkupThis shakeout forced the market to temporarily establish a new monthly low in what could be argued to be a stop-hunt prior to the move to the $6,800s.

2018-9-24 21:29