2022-8-29 09:44 |
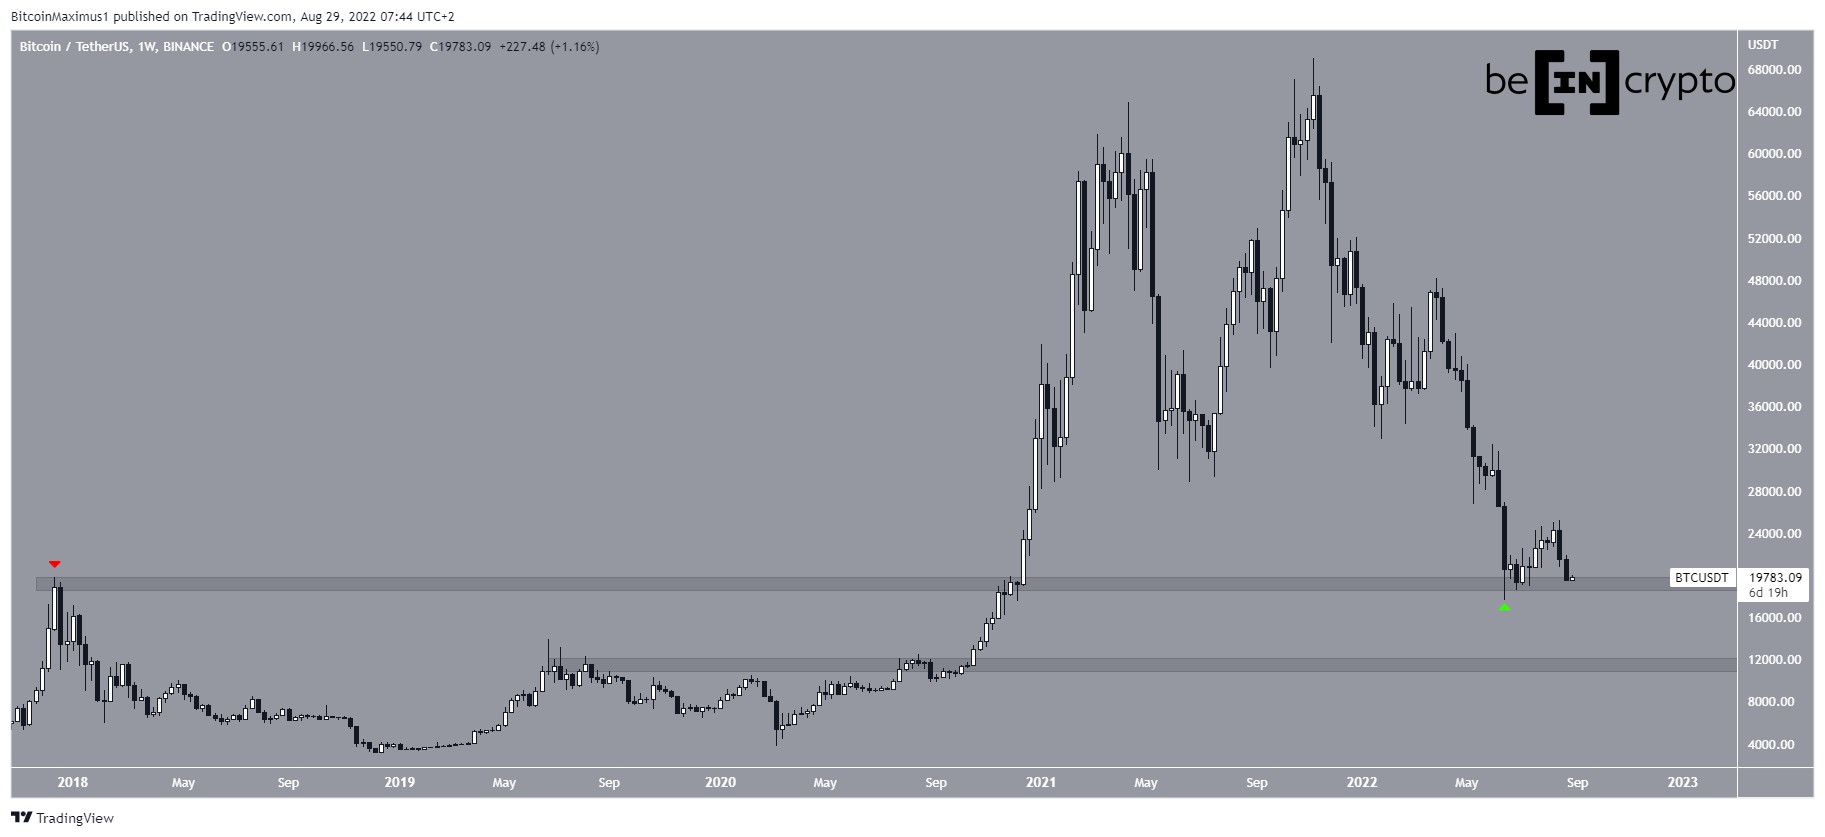
Bitcoin (BTC) has closed two consecutive bearish weekly candlesticks and has nearly fallen to a new yearly low below $20,000.
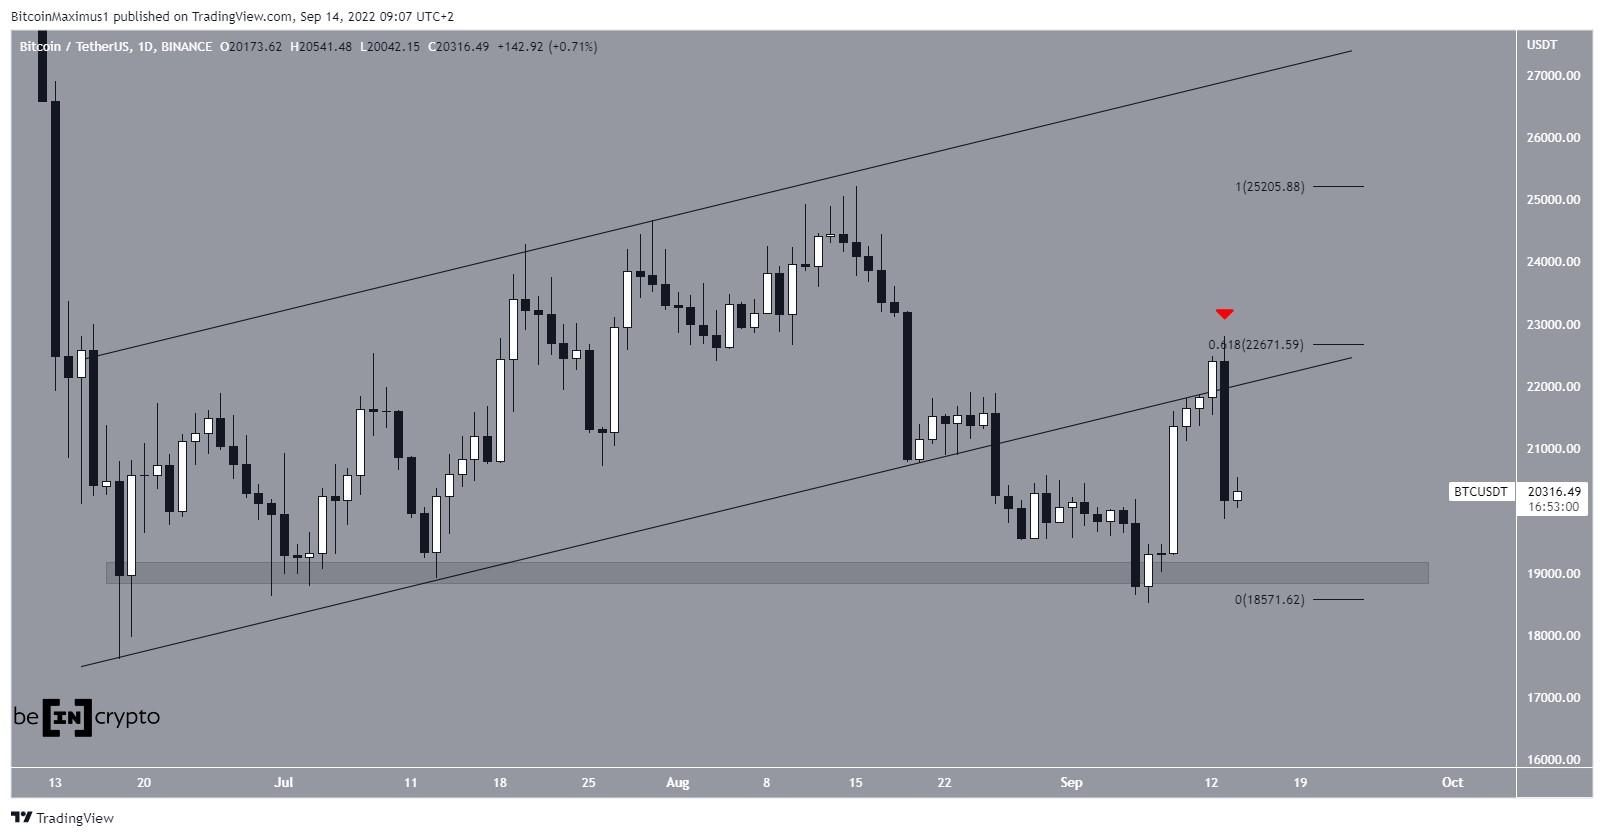
Bitcoin has been trending downward since reaching an all-time high price of $69,000 in November 2021. This has led to a 2022 low of $17,622 in June. The price rebounded afterward (green icon), validating the $19,300 horizontal area as support.
However, the bounce was short-lived, and BTC only managed to reach a local high of $25,211. Currently, Bitcoin has created two consecutive bearish weekly candlesticks and is back trading at the $19,300 horizontal support area.
If a breakdown were to occur, the next important horizontal support area would be found back at $11,500.
BTC/USDT Chart By TradingView BTC breaks down from channelThe daily chart shows that BTC has broken down from an ascending parallel channel that had previously been in place since June 18. Such channels usually contain corrective structures, meaning that a breakdown from them is the most likely scenario. So, the current decrease confirms that the movement is corrective and new lows will follow.
The daily RSI is still decreasing and is considerably below 50, but it still has yet to reach its oversold territory.
In the daily chart, the closest support area is found at $19,100, coinciding with that outlined in the weekly time frame.
BTC/USDT Chart By TradingView Wave count analysisThe most likely long-term wave count now appears to be fully bearish. BTC began a five-wave (white) downward movement after reaching its all-time high and is currently in the fifth and final wave.
Using an external retracement on wave four, the two most likely targets for the bottom are found at $15,400 and $12,700. These targets are the 1.27 and 1.61 external Fib retracement levels, respectively.
The sub-wave counts are shown in black.
BTC/USD Chart By TradingViewThe shorter-term count suggests that Bitcoin is in sub-wave three of the fifth wave. This means that there could still be another sizeable downward move after this.
BTC/USD Chart By TradingViewFor Be[in]Crypto’s previous Bitcoin (BTC) analysis, click here
The post Bitcoin (BTC) Closes Second Consecutive Bearish Week, Falling Below $20,000 appeared first on BeInCrypto.
origin »Bitcoin price in Telegram @btc_price_every_hour
Bitcoin (BTC) на Currencies.ru
|
|