2021-10-4 10:17 |
Bitcoin (BTC) increased considerably during the week of Sept 27 – Oct 3, going from a low of $40,753 to a high of $49,228.
It’s currently in the process of reclaiming the $47,850 area. If successful, it could likely lead to a sustained upward move.
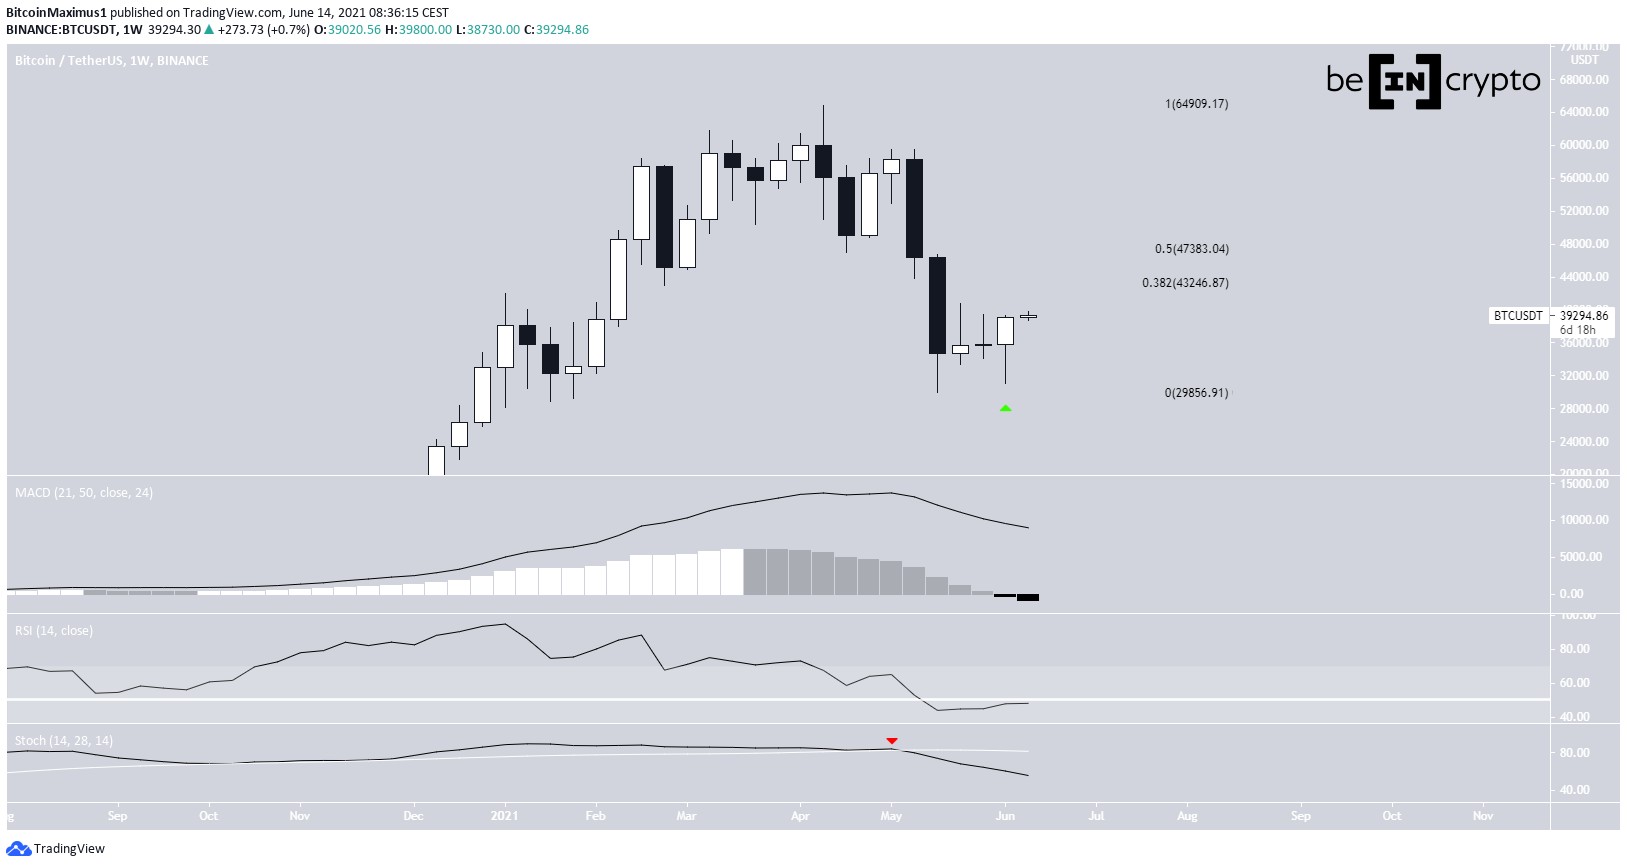
Weekly BTC movementThe weekly chart shows that BTC increased considerably during the week of Sept 27-Oct 3, creating a bullish engulfing candlestick in the process.
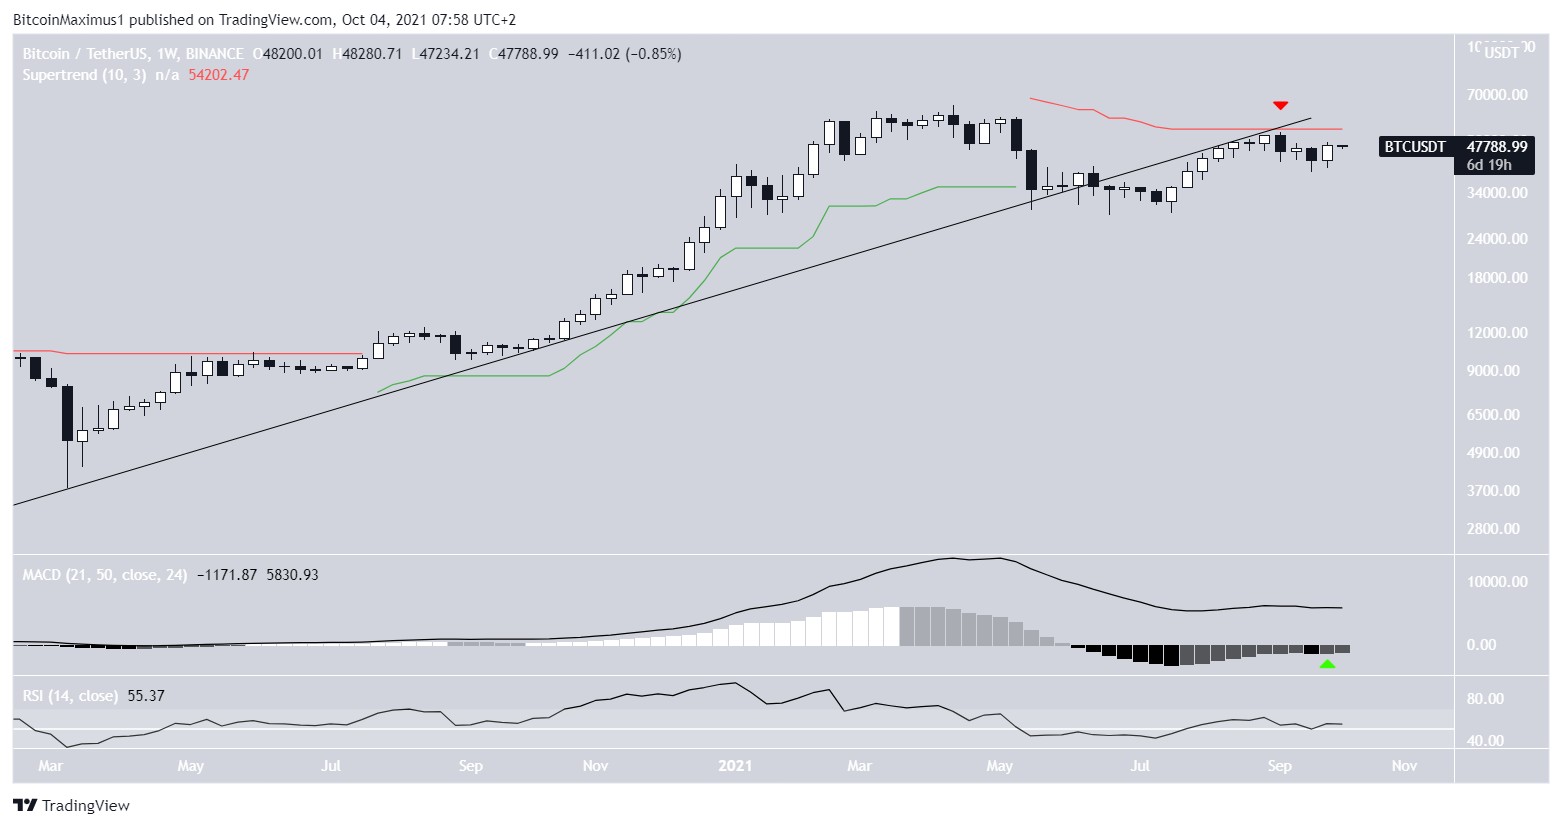
However, it’s still trading below the ascending support line from which it broke down at the beginning of May. Previously, the support line had been in place since the upward move began in March. Bitcoin is also facing resistance from the supertrend resistance line (red icon).
There are several bullish signs in place such as the increasing MACD and RSI. The latter is above 50.
Therefore, the weekly time frame provides mixed signals for the direction of the trend.
BTC Chart By TradingView BTC reclaims resistanceThe daily chart shows that BTC has moved above the $44,000 area, which previously acted as resistance. It did so by creating a bullish candlestick on Oct 1.
Technical indicators have also turned bullish. The MACD has given a bullish reversal signal and is moving upwards. Similarly, the RSI has already moved above 50.
BTC is facing resistance at $47,850. This is a horizontal area and coincides with the daily Supertrend line (red icon). If it manages to clear this level, it’s likely to head towards new highs.
BTC Chart By TradingViewThe six-hour chart shows that BTC has broken out from a descending parallel channel that had previously been in place since Sept 7.
This is a sign that the previous correction has ended and BTC is now moving upwards.
Furthermore, we can see that the previously outlined $47,850 resistance area is also the 0.618 Fib retracement resistance level of the entire downward move.
BTC has already moved above this resistance and is in the process of validating it as support. If it’s successful in reclaiming this level, it’s likely to continue moving upwards.
BTC Chart By TradingView Future movementFinally, the two-hour chart shows that BTC has broken out from an ascending parallel channel. This is a sign that a bullish impulse is in progress.
After a retest of the resistance line of the channel, the most likely scenario could see BTC increasing towards $52,200-$54,200. This target range is found using the length of wave one (black) and an extension on wave one (white).
BTC Chart By TradingViewFor BeInCrypto’s previous Bitcoin (BTC) analysis, click here.
The post Bitcoin (BTC) Aims for New Highs After Bullish Week appeared first on BeInCrypto.
origin »Bitcoin price in Telegram @btc_price_every_hour
Bitcoin (BTC) на Currencies.ru
|
|