2021-12-22 15:01 |
BeInCrypto takes a look at the price movement for seven different cryptocurrencies, including Avalanche (AVAX), which is only 20% below its all-time high price.
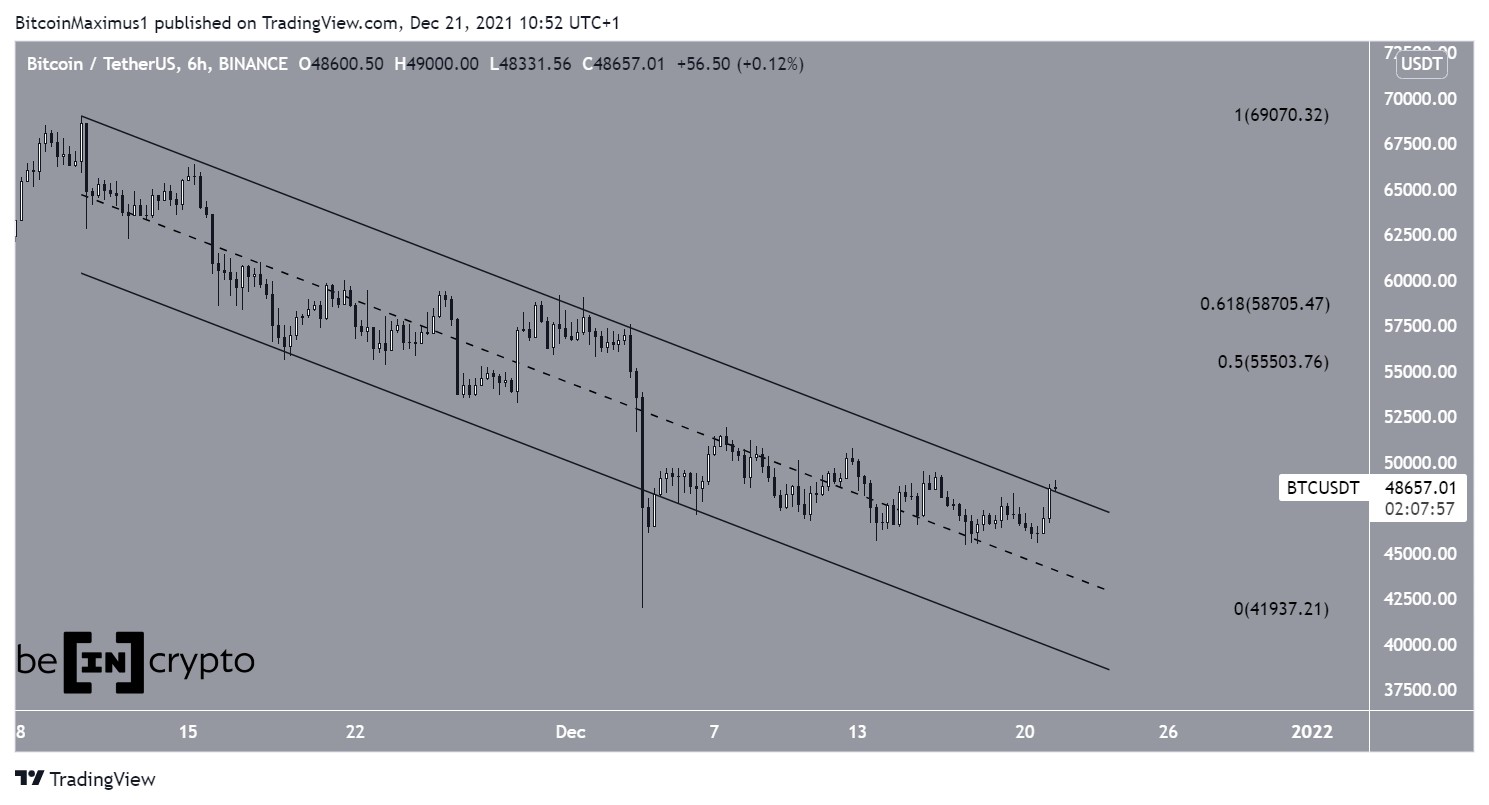
BTCBTC has been trading inside a descending parallel channel since reaching an all-time high price on Nov 10.
On Dec 4, it fell to a local low of $42,000, but bounced considerably and reclaimed the support line of the channel.
Currently, BTC appears to be in the process of breaking out from this channel. If it’s successful in doing so, the next closest resistance area would be found between $55,500-$58,700. This target range is created by the 0.5-0.618 Fib retracement resistance levels.
BTC Chart By TradingView ETHSimilar to BTC, ETH has also been trading inside a descending parallel channel since Nov 10. It broke down from the channel twice, most recently on Dec 15.
However, it bounced back and reclaimed the $3,920 horizontal area. This is a very bullish development that could lead to a significant upward move.
A bullish reversal would be confirmed if ETH is able to reclaim the midline of the channel.
ETH Chart By TradingView XRPXRP is also trading inside a descending parallel channel. However, this is a much longer-term channel that’s been in place since the beginning of September.
On Dec 4, XRP bounced at its support line and has been moving upwards since.
Similar to ETH, reclaiming the midline of the channel would be necessary for confirmation of a bullish reversal.
XRP Chart By TradingView FTTFTT has been falling since reaching an all-time high of $85.74 on Sept 9. The downward move led to a low of $35.96 on Dec 17.
However, FTT rebounded, validating the $35.40 area as support. This is the 0.786 Fib retracement support level and a horizontal support area.
More importantly, it seems that FTT has completed an A-B-C corrective structure, in which waves A:C had an exact 1:1 ratio. If true, FTT could soon make another attempt at breaking the descending resistance near $50.
FTT Chart By TradingView ONEONE has been falling since reaching an all-time high price of $0.38 on Oct 26. The downward move led to a low of $0.135 on Dec 4. This seemingly caused it to break down from a long-term ascending support line.
However, ONE bounced back and reclaimed the line. Furthermore, it reclaimed the $0.225 horizontal area, which previously acted as the all-time high resistance level.
This is a very bullish development that suggests the correction is complete. It could eventually take ONE towards a new all-time high price.
ONE Chart By TradingView HNTHNT had been decreasing beneath a descending resistance line since reaching an all-time high price on Nov 7. This led to a low of $25 on Dec 4.
HNT was able to bounce back and broke out above the line on Dec 16.
If it continues increasing, the closest resistance would be found between $42.20-$46.20. This range is created by the 0.5-0.618 Fib retracement resistance levels.
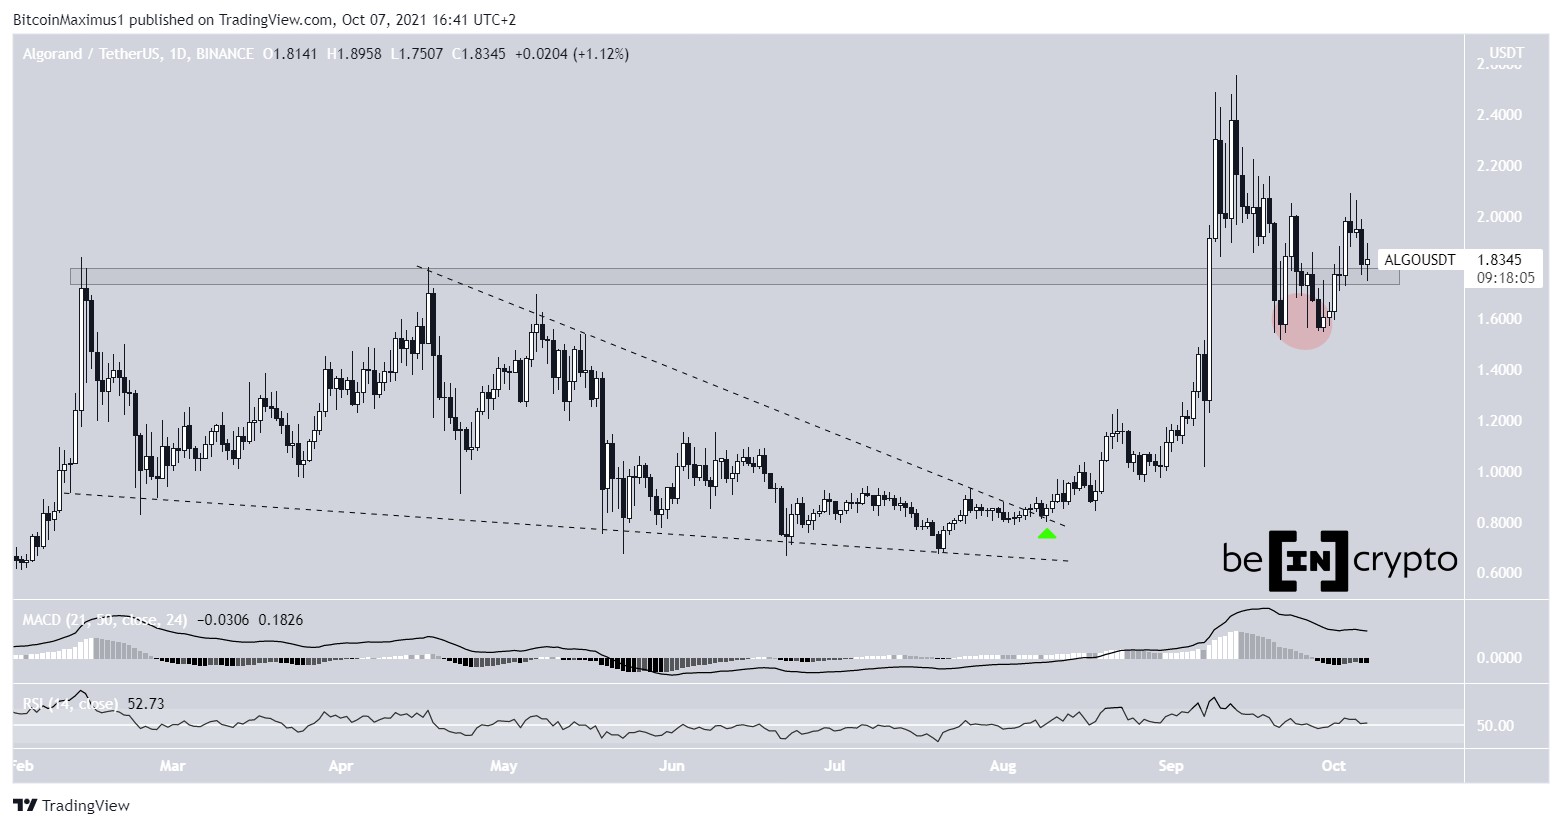
HNT Chart By TradingView AVAXIn the period between Dec 4 and Dec 13, AVAX bounced multiple times at the $80 horizontal support area (green icons). The area previously acted as the all-time high resistance, so the bounces served to validate it as support.
Following the final bounce, AVAX broke out from a descending resistance line and is now on its way towards a new all-time high price.
If successful in moving above it, the next resistance would be found at $189.
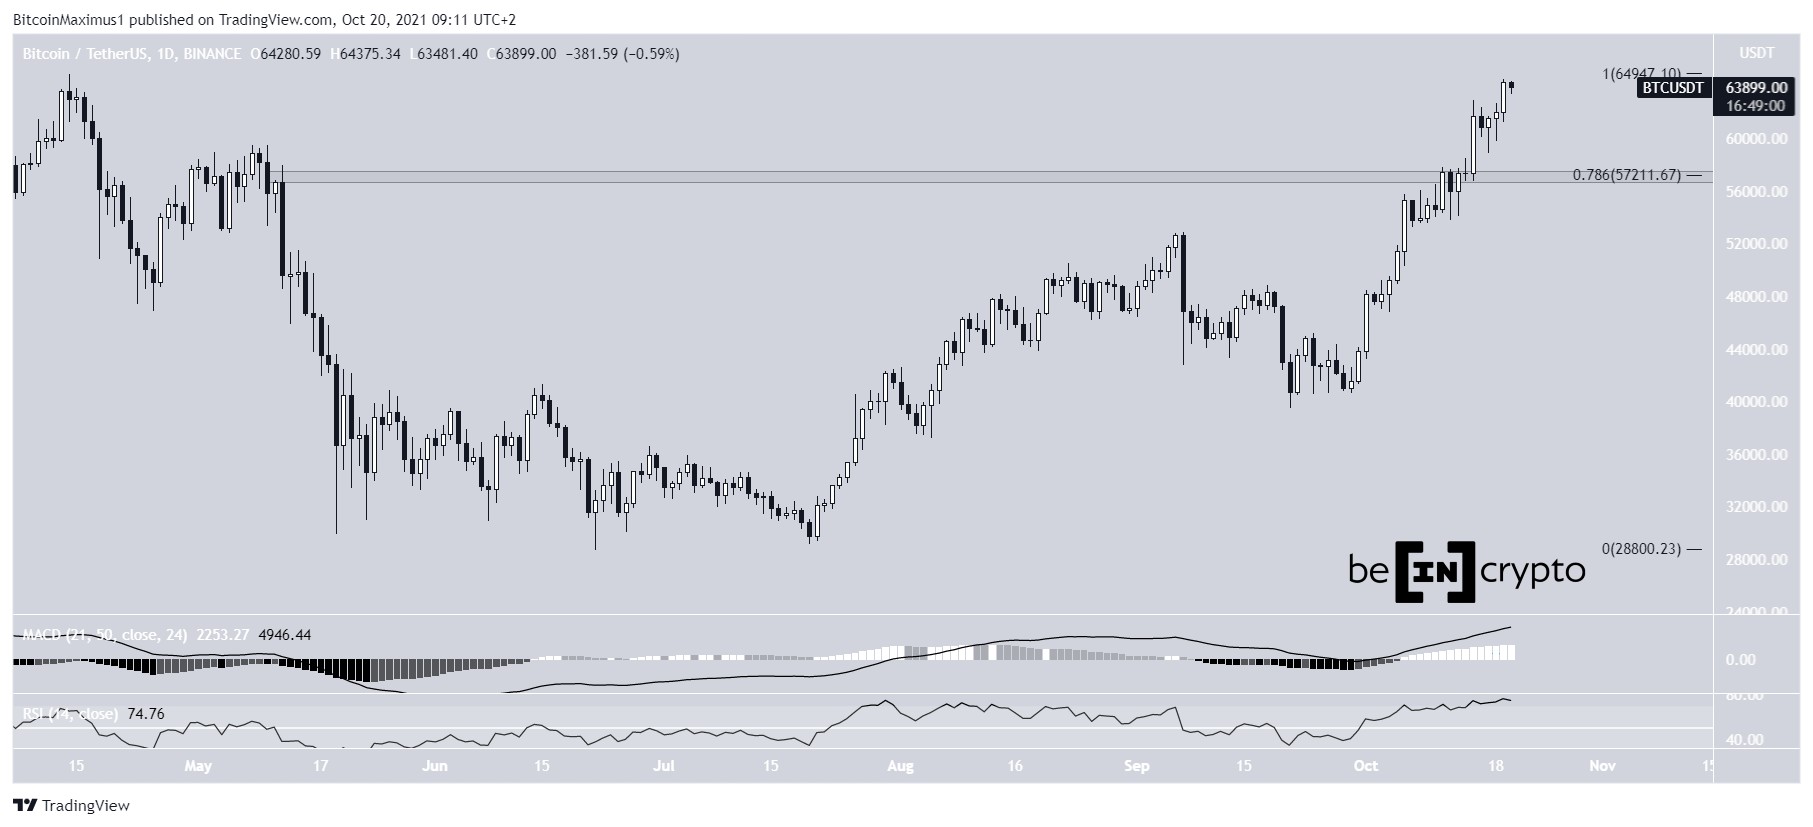
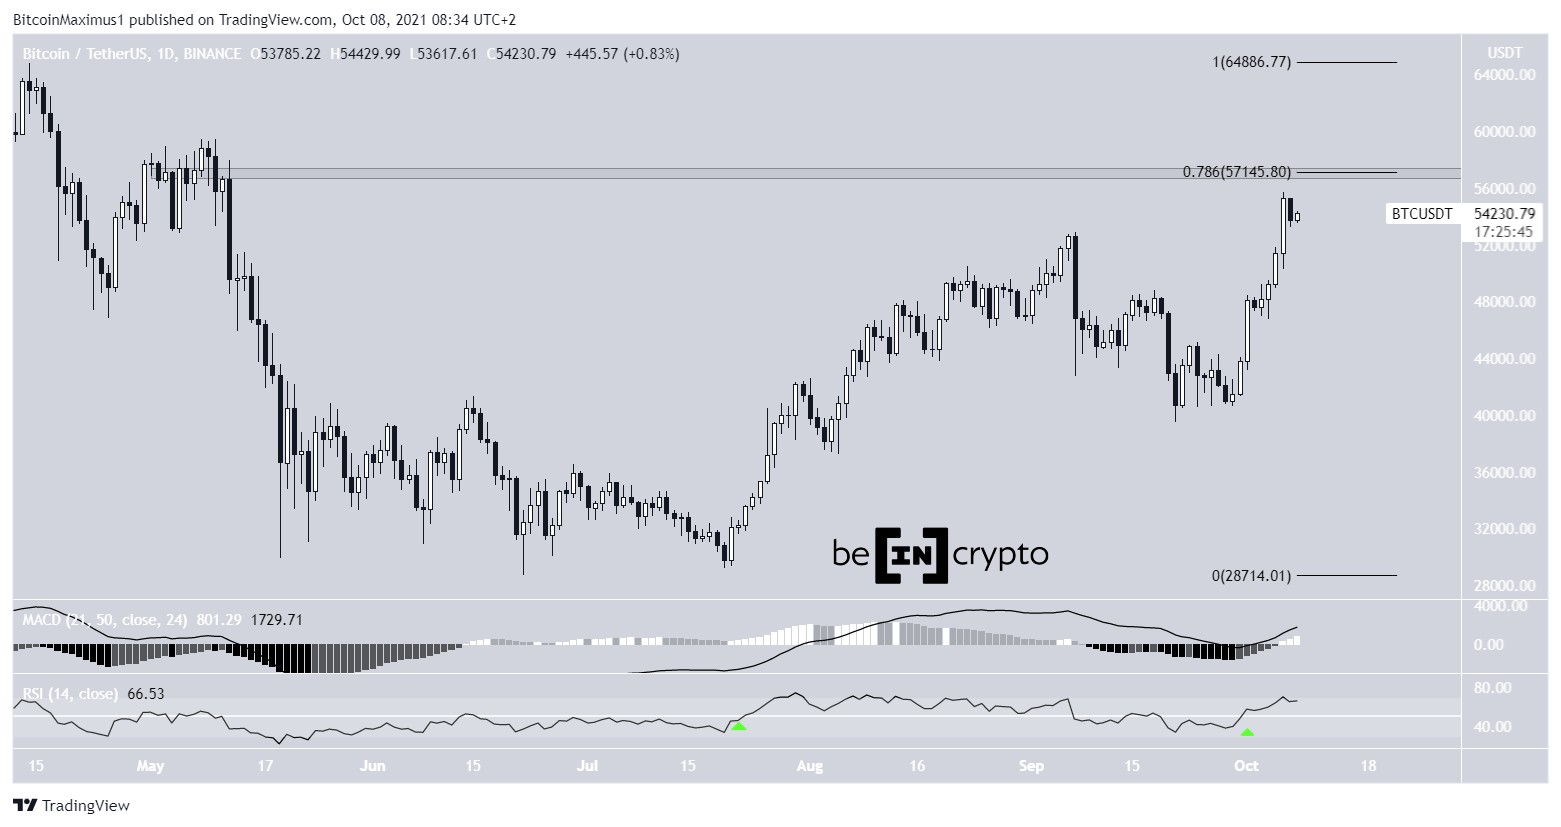
AVAX Chart By TradingViewFor BeInCrypto’s latest Bitcoin (BTC) analysis, click here
The post Avalanche (AVAX) Reclaims Previous All-Time High — Multi Coin Analysis appeared first on BeInCrypto.
Similar to Notcoin - Blum - Airdrops In 2024
High Voltage (HVCO) на Currencies.ru
|
|


