2020-4-29 04:00 |
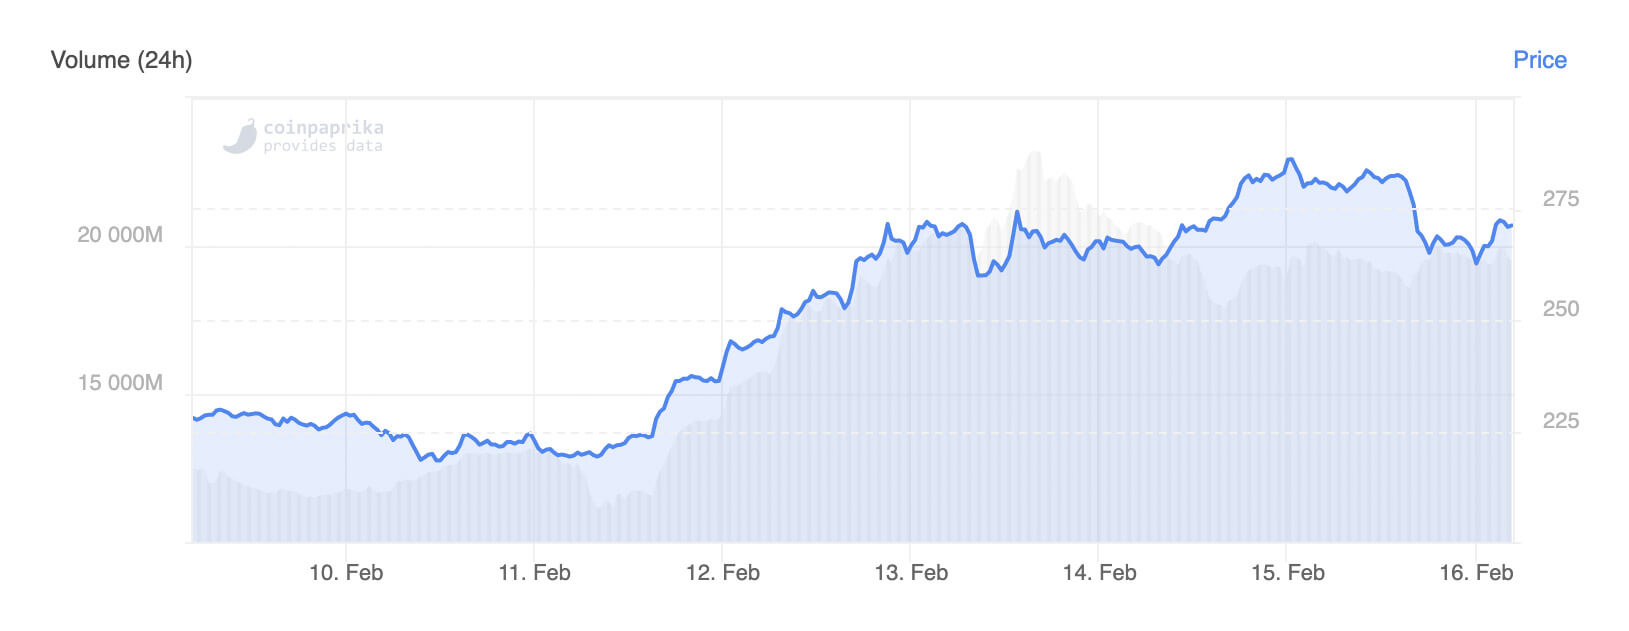
It’s been a boring past 24 hours for the crypto market, especially for Ethereum. Despite rallies in a swath of other altcoins, the top-two cryptocurrency has been flat on Tuesday, trading a mere 0.70% high according to data from CoinMarketCap. Unfortunately, analysts believe that it’s about to get a lot worse for the altcoin, with one going as far as to say that “everything” on the asset’s chart is signaling an imminent correction. This adds to a confluence of other bearish factors that others have noticed. Analyst: Ethereum Is so Poised to “Dump,” It’s “Obvious” Saying that Ethereum has performed well over the past few weeks would be an understatement. Since March’s lows, the cryptocurrency has rallied by 120%, surging from $88 to as high as $200 in a stunning fashion. On a medium-term perspective, the rally has been barely interrupted, with the weekly chart showing a series of consecutively green performances. But, according to a crypto trader, “everything” on Ethereum’s short-term chart is suggestive of an imminent drop. Identifying the three bearish technical trends, which include two textbook bearish formations and a bearish divergence, in an April 28th post published to his Telegram channel, the analyst wrote: “Diamond top within a rising wedge, while price rises with volume declining. Everything about this says it should dump.” Chart from Byzantine General (Telegram channel) Further corroborating his bearish outlook on the leading cryptocurrency, the trader observed that pew data he obtained, there’s been a large influx of Ether deposits into exchanges. This “usually leads to selling,” the analyst wrote, in reference to the sentiment that coins are deposited on exchanges to be sold off. All Eyes On Bitcoin This bearish analysis comes as Bitcoin has begun to rub up against key resistance at $7,800 — a level of extreme historical importance according to trader Josh Rager. There are some taking this with a half-glass-full approach, saying that the consolidation under $7,800 is suggestive of a breakout. However, most are convinced that a drop from the current levels is more likely. The fact that $7,800 held as resistance on the multiple times the asset has tried to break through that level only corroborated this. A crypto trader that called the rally toward $8,000 nearly two weeks ago has become a seller, writing “how obvious” it is that $7,800 has become a zone of resistance, marked by a “loss in momentum on order flow [data] from earlier today to Asia’s [Monday] AM session.” Chart from @LightCrypto (Twitter) The analyst added that Bitcoin’s recent price action has formed a “swing failure” — when an asset attempts to break past a historical resistance or support level but fails, leaving a strong wick on high volumes, then often a trend reversal. Considering the historical correlation between cryptocurrencies, BTC experiencing rejection at current prices will likely lead Ether to follow suit. Photo by Adrien Converse on Unsplash
Similar to Notcoin - Blum - Airdrops In 2024
Ethereum (ETH) на Currencies.ru
|
|


