2026-2-6 00:00 |
HYPE has been stuck in a choppy stretch after failing to hold its push above the mid-$30s.The price has bounced back several times around the low-$32s, each time the price makes an attempt to move higher, another rejection occurs around the $35 mark.
This has made the market quite fragile as everyone is leaning long based on support levels, but the risk of falling down is building quietly. This volatility squeeze could lead to a sudden move if the support levels begin to fail.
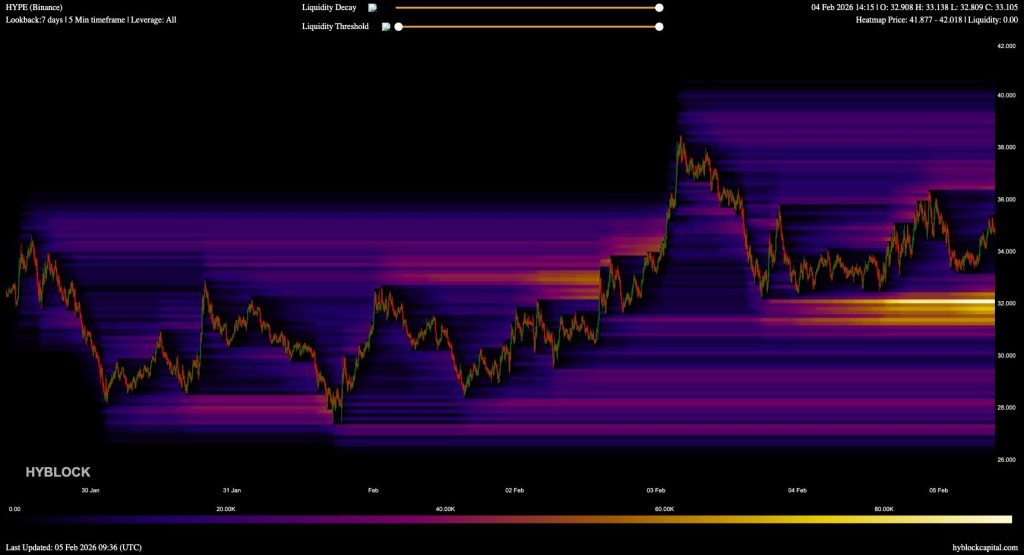
Ardi’s heatmap is basically showing a classic liquidation setup forming right underneath the HYPE price. Even though price action looks fairly calm on the surface, there’s a lot going on below.
The chart shows a huge liquidity zone stacked between $28 and $32, which is exactly where a lot of leveraged longs would get forced out if things start slipping. Right now, the HYPE price is hovering in the low-$30s, but the deeper story is that the market is building a massive pool of exposure underneath.
One of the clearest levels on the chart is $32.5. The HYPE price keeps bouncing off it, and buyers keep stepping in like it’s solid support. But there’s a catch, every time the price tries to push higher, it keeps getting rejected near $35.
That repeated failure creates a trap. Traders keep going long expecting the same bounce again, and that only adds more liquidation pressure below. The longer the HYPE price stays stuck under resistance, the bigger that downside pool becomes.
Source: X/@ArdiNSCThe brightest area on the heatmap sits directly under current price, and that’s the big warning sign. Ardi calls it a “wall of long liquidations,” and it’s easy to see why. There’s a thick concentration of levels where longs would get wiped out fast if support breaks.
If the HYPE price loses $32.5 cleanly, the chart shows a pretty open runway down toward $28. Moves like that don’t usually happen slowly, liquidation cascades can send price dropping in a hurry.
Read Also: Ripple’s Hyperliquid Move Could Change How Wall Street Trades Crypto
Why Market Makers Love These SetupsArdi’s message is simple: if support cracks, market makers feast. That happens because liquidity zones act like magnets. When too many traders pile into longs in the same area, price often gets pushed down to clear them out before any real bounce can happen.
The HYPE price is still holding for now, but the pressure underneath keeps building. A breakout above resistance would flip the whole setup, but as long as $35 keeps rejecting, that liquidation risk stays very real.
At this point, the chart makes one thing clear: the HYPE price isn’t breaking yet, but the liquidity below is getting heavier every day.
Subscribe to our YouTube channel for daily crypto updates, market insights, and expert analysis.
The post Hyperliquid (HYPE) Price Might Be Entering the “Trap Phase” Before the Next Move appeared first on CaptainAltcoin.
origin »Bitcoin price in Telegram @btc_price_every_hour
ETH/LINK Price Action Candlestick Set (LINKETHPA) на Currencies.ru
|
|


